- Home
- CentOS Overview
- Basic CentOS Linux Commands
- File / Folder Management
- User Management
- Quota Management
- Systemd Services Start and Stop
- Resource Mgmt with systemctl
- Resource Mgmt with crgoups
- Process Management
- Firewall Setup
- Configure PHP in CentOS Linux
- Set Up Python with CentOS Linux
- Configure Ruby on CentOS Linux
- Set Up Perl for CentOS Linux
- Install and Configure Open LDAP
- Create SSL Certificates
- Install Apache Web Server CentOS 7
- MySQL Setup On CentOS 7
- Set Up Postfix MTA and IMAP/POP3
- Install Anonymous FTP
- Remote Management
- Traffic Monitoring in CentOS
- Log Management
- Backup and Recovery
- System Updates
- Shell Scripting
- Package Management
- Volume Management
Linux Admin - Traffic Monitoring in CentOS
There are several third party tools that can add enhanced capabilities for CentOS traffic monitoring. In this tutorial, we will focus on those that are packaged in the main CentOS distribution repositories and the Fedora EPEL repository.
There will always be situations where an Administrator (for one reason or another) is left with only tools in the main CentOS repositories. Most utilities discussed are designed to be used by an Administrator with the shell of physical access. When traffic monitoring with an accessible web-gui, using third party utilities such as ntop-ng or Nagios is the best choice (versus re-creating such facilities from scratch).
For further research on both configurable web-gui solutions, following are a few links to get started on research.
Traffic Monitoring for LAN / WAN Scenarios
Nagios
Nagios has been around for a long time, therefore, it is both tried and tested. At one point it was all free and open-source, but has since advanced into an Enterprise solution with paid licensing models to support the need of Enterprise sophistication. Hence, before planning any rollouts with Nagios, make sure the open-source licensed versions will meet your needs or plan on spending with an Enterprise Budget in mind.
Most open-source Nagios traffic monitoring software can be found at − https://www.nagios.org
For a summarized history of Nagious, here is the official Nagios History page − https://www.nagios.org/about/history/
ntopng
Another great tool allowing bandwidth and traffic monitoring via a web-gui is called ntopng. ntopng is similar to the Unix utility ntop, and can collect data for an entire LAN or WAN. Providing a web-gui for administration, configuration, and charting makes it easy to use for the entire IT Departments.
Like Nagious, ntopng has both open-source and paid enterprise versions available. For more information about ntopng, please visit the website: http://www.ntop.org/
Install Fedora EPEL Repository Extra Packages for Enterprise Linux
To access some of the needed tools for traffic monitoring, we will need to configure our CentOS system to use the EPEL Repository.
The EPEL Repository is not officially maintained or supported by CentOS. However, it is maintained by a group of Fedora Core volunteers to address the packages commonly used by Enterprise Linux professionals not included in either CentOS, Fedora Core, or Red Hat Linux Enterprise.
Caution
Remember, the EPEL Repository is not official for CentOS and may break compatibility and functionality on production servers with common dependencies. With that in mind, it is advised to always test on a non-production server running the same services as production before deploying on a system critical box.
Really, the biggest advantage of using the EHEL Repository over any other third party repository with CentOS is that we can be sure the binaries are not tainted. It is considered a best practice to not use the repositories from an untrusted source.
With all that said, the official EPEL Repository is so common with CentOS that it can be easily installed via YUM.
[root@CentOS rdc]# yum -y install epel-release
 Loaded plugins: fastestmirror, langpacks
 Loading mirror speeds from cached hostfile
 * base: repo1.dal.innoscale.net
 * extras: repo1.dal.innoscale.net
 * updates: mirror.hmc.edu
Resolving Dependencies
   --> Running transaction check
   ---> Package epel-release.noarch 0:7-9 will be installed
   --> Finished Dependency Resolution
Dependencies Resolved
--{ condensed output }--
After installing the EPEL Repository, we will want to update it.
[root@CentOS rdc]# yum repolist
Loaded plugins: fastestmirror, langpacks
epel/x86_64/metalink
|  11 kB  00:00:00
epel
| 4.3 kB  00:00:00
(1/3): epel/x86_64/group_gz
| 170 kB  00:00:00
(2/3): epel/x86_64/updateinfo
| 753 kB  00:00:01
(3/3): epel/x86_64/primary_db
--{ condensed output }--
At this point, our EPEL repository should be configured and ready to use. Let's start by installing nload for interface bandwidth monitoring.
The tools we will focus on in this tutorial are −
- nload
- ntop
- ifstst
- iftop
- vnstat
- net hogs
- Wireshark
- TCP Dump
- Traceroute
These are all standard for monitoring traffic in Linux Enterprises. The usage of each range from simple to advanced, so we will only briefly discuss tools such as Wireshark and TCP Dump.
Install and Use nload
With our EPEL Repositories installed and configured in CentOS, we now should be able to install and use nload. This utility is designed to chart bandwidth per interface in real-time.
Like most other basic installs nload is installed via the YUM package manager.
[root@CentOS rdc]# yum -y install nload
Resolving Dependencies
--> Running transaction check
---> Package nload.x86_64 0:0.7.4-4.el7 will be installed
--> Finished Dependency Resolution
Dependencies Resolved
===============================================================================
===============================================================================
 Package                             Arch
 Version                           Repository                          Size
===============================================================================
===============================================================================
Installing:
 nload                               x86_64
 0.7.4-4.el7                        epel                                70 k
Transaction Summary
===============================================================================
===============================================================================
Install  1 Package
Total download size: 70 k
Installed size: 176 k
Downloading packages:
--{ condensed output }--
Now we have nload installed, and using it is pretty straight forward.
[root@CentOS rdc]# nload enp0s5
nload will monitor the specified interface. In this case, enp0s5 an Ethernet interface, in real-time from the terminal for network traffic loads and total bandwidth usage.
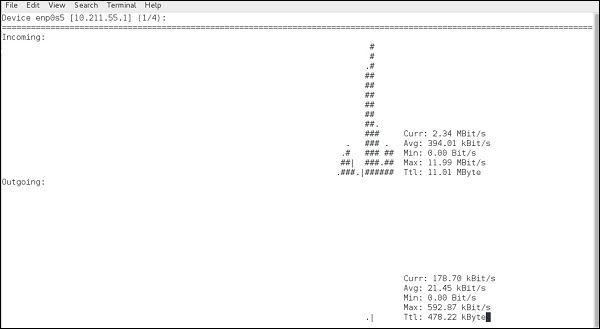
As seen, nload will chart both incoming and outgoing data from the specified interface, along with providing a physical representation of the data flow with hash marks "#".
The depicted screenshot is of a simple webpage being loaded with some background daemon traffic.
Common command line switches for nload are −
| Command | Action |
|---|---|
| -a | Time period |
| -t | Time update interval in milliseconds, the default is 500 |
| -u | Sets display of traffic measurement h |
| -U | Sets total in/out traffic measurement units same options as -u |
The standard syntax for nload is −
nload [options] <interface>
If no interface is specified, nload will automatically grab the first Ethernet interface. Let's try measuring the total data in/out in Megabytes and current data-transfer speeds in Megabits.
[root@CentOS rdc]# nload -U M -u m
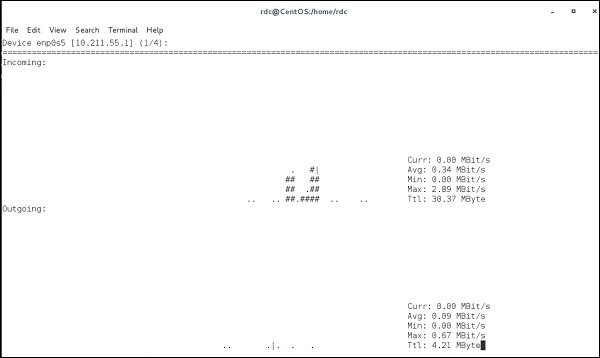
Data coming in/out the current interface is measured in megabits per second and each "Ttl" row, representing total data in/out is displayed in Megabytes.
nload is useful for an administrator to see how much data has passed through an interface and how much data is currently coming in/out a specified interface.
To see other interfaces without closing nload, simply use the left/right arrow keys. This will cycle through all available interfaces on the system.
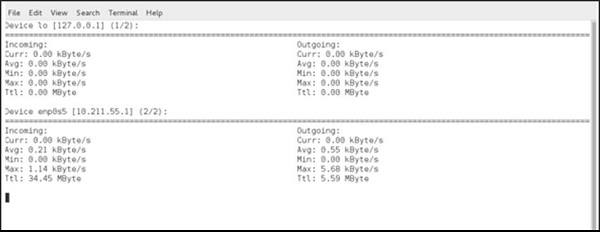
It is possible to monitor multiple interfaces simultaneously using the -m switch −
[root@CentOS rdc]# nload -u K -U M -m lo -m enp0s5
load monitoring two interfaces simultaneously (lo and enp0s5) −