 Data Structure
 Networking
 RDBMS
RDBMS Operating System
 Java
Java MS Excel
 iOS
iOS HTML
HTML CSS
CSS Android
 Python
 C Programming
 C++
C++ C#
C# MongoDB
 MySQL
MySQL Javascript
 PHP
PHP
- Selected Reading
- UPSC IAS Exams Notes
- Developer's Best Practices
- Questions and Answers
- Effective Resume Writing
- HR Interview Questions
- Computer Glossary
- Who is Who
Locally Weighted Linear Regression in Python
Locally Weighted Linear Regression is a non?parametric method/algorithm. In Linear regression, the data should be distributed linearly whereas Locally Weighted Regression is suitable for non?linearly distributed data. Generally, in Locally Weighted Regression, points closer to the query point are given more weightage than points away from it.
Parametric and Non-Parametric Models
Parametric
Parametric models are those which simplify the function to a known form. It has a collection of parameters that summarize the data through these parameters.
These parameters are fixed in number, which means that the model already knows about these parameters and they do not depend on the data. They are also independent in nature with respect to the training samples.
As an example, let us have a mapping function as described below.
b0+b1x1+b2x2=0
From the equation, b0, b1, and b2 are the coefficients of the line that controls the intercept and slope. Input variables are represented by x1 and x2.
Non - Parametric
Non?parametric algorithms do not make particular assumptions about the kind of mapping function. These algorithms do not accept a specific form of the mapping function between input and output data as true.
They have the freedom to choose any functional form from the training data. As a result, for parametric models to estimate the mapping function they require much more data than parametric ones.
Derivation of Cost Function and weights
The cost function of linear regression is
$$\mathrm{\displaystyle\sum\limits_{i=1}^m (y^{{(i)}} \:-\:\Theta^Tx)^2}$$
In case of Locally Weighted Linear Regression, the cost function is modified to
$$\mathrm{\displaystyle\sum\limits_{i=1}^m w^i(w^{{(i)}} \:-\:\Theta^Tx)^2}$$
where ?(?) denotes the weight of ith training sample.
The weighting function can be defined as
$$\mathrm{w(i)\:=\:exp\:(-\frac{x^i-x^2}{2\tau^2})}$$
x is the point where we want to make the prediction. x(i) is the ith training example
? can be called as the bandwidth of the Gaussian bell?shaped curve of the weighing function.
The value of ? can be adjusted to vary the values of w based on distance from the query point.
A small value for ? means smaller distance of the data point to the query point where value of w becomes large (more weightage) and vice versa.
The Value of w Typically Ranges From 0 to 1.
The locally Weighted Regression algorithm does not have a training phase. All weights, ? are determined during the prediction phase.
Example
Let us consider a dataset consisting of the following points:
2,5,10,17,26,37,50,65,82
Taking a query point as x = 7 and three points from the dataset 5,10,26
Therefore x(1) = 5, x(2) = 10 , x(3) = 26 . Let ? = 0.5
Thus,
$$\mathrm{w(1) = exp( - ( 5 - 7 )^2 / 2 x 0.5^2) = 0.00061}$$
$$\mathrm{w(2) = exp( - (9 - 7 )^2 / 2 x 0.5^2) = 5.92196849e-8}$$
$$\mathrm{w(3) = exp( - (26 - 7 )^2 / 2 x 0.5^2) = 1.24619e-290}$$
$$\mathrm{J(\Theta) = = 0.00061 * (\Theta^ T x(1) - y(1) ) + 5.92196849e-8 * (\Theta^ T x(2) - y(2) ) + 1.24619e-290 *( \Theta^ T x(3) - y(3) )}$$
From the above examples it is evident that, the closer the query point (x) to the a particular data point/sample x(1),x(2),x(3) . etc. the larger is the value for w. The weightage decreases / falls exponentially for data points far away from the query point.
As the distance between x(i) and x increases, weights decrease. This decreases the contribution of error term to the cost function and vice versa.
Implementation in Python
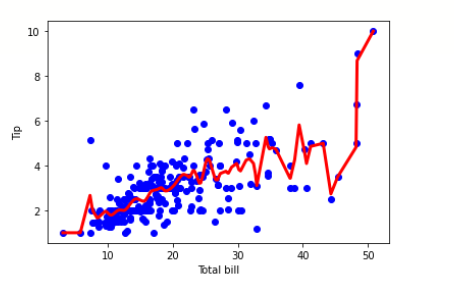
The below snippet demonstrates a Locally weighted Linear Regression Algorithm.
The tips dataset can be downloaded from here
Example
import pandas as pd
import numpy as np
import matplotlib.pyplot as plt
%matplotlib inline
df = pd.read_csv('/content/tips.csv')
features = np.array(df.total_bill)
labels = np.array(df.tip)

def kernel(data, point, xmat, k):
   m,n = np.shape(xmat)
   ws = np.mat(np.eye((m)))
   for j in range(m):
      diff = point - data[j]
      ws[j,j] = np.exp(diff*diff.T/(-2.0*k**2))
   return ws

def local_weight(data, point, xmat, ymat, k):
   wei = kernel(data, point, xmat, k)
   return (data.T*(wei*data)).I*(data.T*(wei*ymat.T))

def local_weight_regression(xmat, ymat, k):
   m,n = np.shape(xmat)
   ypred = np.zeros(m)
   for i in range(m):
      ypred[i] = xmat[i]*local_weight(xmat, xmat[i],xmat,ymat,k)
   return ypred

m = features.shape[0]
mtip = np.mat(labels)
data = np.hstack((np.ones((m, 1)), np.mat(features).T))

ypred = local_weight_regression(data, mtip, 0.5)
indices = data[:,1].argsort(0)
xsort = data[indices][:,0]

fig = plt.figure()
ax = fig.add_subplot(1,1,1)
ax.scatter(features, labels, color='blue')
ax.plot(xsort[:,1],ypred[indices], color = 'red', linewidth=3)
plt.xlabel('Total bill')
plt.ylabel('Tip')
plt.show()
Output

When can we use Locally weighted Linear Regression?
When the number of features is small.
When feature selection is not required
Advantage of Locally weighted Linear Regression.
In Locally Weighted Linear Regression, local weights are calculated in relation to each datapoint so there are fewer chances of large errors.
We fit a curved line as a result, the errors are minimized.
In this algorithm, there are many small local functions rather than one global function which is to be minimized. Local functions are more effective in adjusting variation and errors.
Disadvantages of Locally weighted Linear Regression.
This process is highly exhaustive and may consume a huge amount of resources.
We may simply avoid the Locally Weighted algorithm for linearly related problems which are simpler.
Cannot accommodate a large number of features.
Conclusion
So, in brief, a Locally weighted Linear Regression is more suited to situations where we have a nonlinear distribution of data and we still want to fit the data with a regression model without compromising on the quality of predictions.

