- Julia - Home
- Julia - Overview
- Julia - Environment Setup
- Julia - Basic Syntax
- Julia - Arrays
- Julia - Tuples
- Integers & Floating-Point Numbers
- Julia - Rational & Complex Numbers
- Julia - Basic Operators
- Basic Mathematical Functions
- Julia - Strings
- Julia - Functions
- Julia - Flow Control
- Julia - Dictionaries & Sets
- Julia - Date & Time
- Julia - Files I/O
- Julia - Metaprogramming
- Julia - Plotting
- Julia - Data Frames
- Working with Datasets
- Julia - Modules and Packages
- Working with Graphics
- Julia - Networking
- Julia - Databases
- Julia Useful Resources
- Julia - Quick Guide
- Julia - Useful Resources
- Julia - Cheatsheet
- Julia - Discussion
Julia Programming - Plotting
Julia has various packages for plotting and before starting making plots, we need to first download and install some of them as follows −
(@v1.5) pkg> add Plots PyPlot GR UnicodePlots
The package Plots is a high-level plotting package, also referred to as back-ends interfaces with other plotting packages. To start using the Plots package, type the following command −
julia> using Plots[ Info: Precompiling Plots [91a5bcdd-55d7-5caf-9e0b-520d859cae80]
Plotting a function
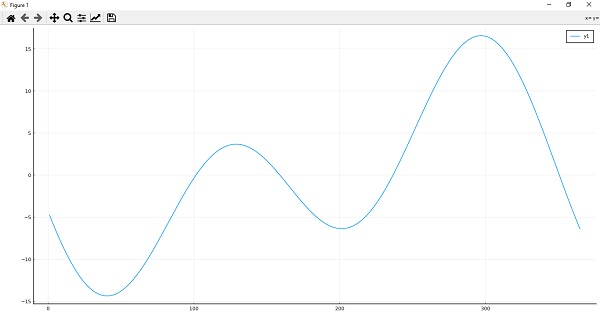
For plotting a function, we need to switch back to PyPlot back-end as follows −
julia> pyplot()Plots.PyPlotBackend()
Here we will be plotting the equation of Time graph which can be modeled by the following function −
julia> eq(d) = -7.65 * sind(d) + 9.87 * sind(2d + 206);julia> plot(eq, 1:365)sys:1: MatplotlibDeprecationWarning: Passing the fontdict parameter of _set_ticklabels() positionally is deprecated since Matplotlib 3.3; the parameter will become keyword-only two minor releases later.sys:1: UserWarning: FixedFormatter should only be used together with FixedLocator
Packages
Everyone wants a package that helps them to draw quick plots by text rather than graphics.
UnicodePlots
Julia provides one such package called UnicodePlots which can produce the following −
scatter plots
line plots
bar plots
staircase plots
histograms
sparsity patterns
density plots
We can add it to our Julia installation by the following command −
(@v1.5) pkg> add UnicodePlots
Once added, we can use this to plot a graph as follows:
julia> using UnicodePlots
Example
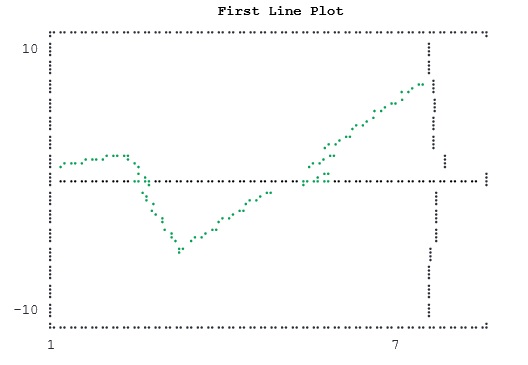
Following Julia example generates a line chart using UnicodePlots.
julia> FirstLinePlot = lineplot([1, 2, 3, 7], [1, 2, -5, 7], title="First Line Plot", border=:dotted) First Line Plot
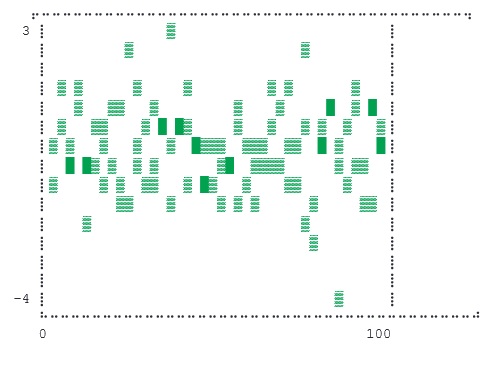
Example
Following Julia example generates a density chart using UnicodePlots.
Julia> using UnicodePlotsJulia> FirstDensityPlot = densityplot(collect(1:100), randn(100), border=:dotted)
VegaLite
This Julia package is a visualization grammar which allows us to create visualization in a web browser window. With this package, we can −
describe data visualization in a JSON format
generate interactive views using HTML5 Canvas or SVG
It can produce the following −
Area plots
Bar plots/Histograms
Line plots
Scatter plots
Pie/Donut charts
Waterfall charts
Worldclouds
We can add it to our Julia installation by following command −
(@v1.5) pkg> add VegaLite
Once added we can use this to plot a graph as follows −
julia> using VegaLite
Example
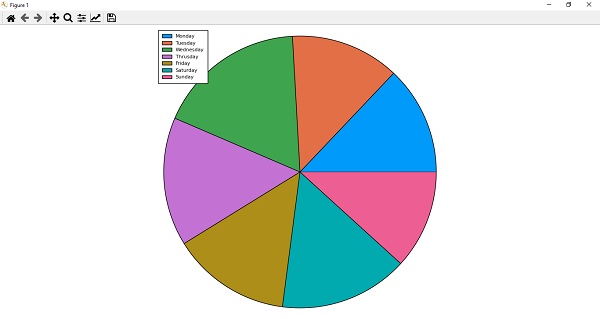
Following Julia example generates a Pie chart using VegaLite.
julia> X = ["Monday", "Tuesday", "Wednesday", "Thrusday", "Friday","Saturday","Sunday"];julia> Y = [11, 11, 15, 13, 12, 13, 10]7-element Array{Int64,1}: 11 11 15 13 12 13 10 julia> P = pie(X,Y)