 Data Structure
 Networking
 RDBMS
RDBMS Operating System
 Java
Java MS Excel
 iOS
iOS HTML
HTML CSS
CSS Android
 Python
 C Programming
 C++
C++ C#
C# MongoDB
 MySQL
MySQL Javascript
 PHP
PHP
- Selected Reading
- UPSC IAS Exams Notes
- Developer's Best Practices
- Questions and Answers
- Effective Resume Writing
- HR Interview Questions
- Computer Glossary
- Who is Who
Julia Fractal in Python
Julia Fractal in Python: Introduction
Fractals are intriguing mathematical entities that display complex and repetitive patterns. The Julia fractal, which bears the name of French mathematician Gaston Julia, is one such fascinating fractal. Iterating a straightforward mathematical function over complex integers creates the Julia fractal. In the fields of mathematics and computer graphics, it has been a topic of research and investigation. We will explore the world of Julia fractals and discover how to make them using Python in this article.
Julia Fractal in Python
Definition
An intricate iterative function serves as the formula for the Julia fractal. It is created by repeatedly solving the equation for each point in the complex plane as follows
Z_{n+1} = Z_{n}^2 + C
Here, "Z_n" is the complex number at iteration n, "Z_n+1" denotes the complex number at iteration (n+1), and "C" is a fixed complex number that specifies the fractal's structure. The fractal that results is created by color-coding every point according to how many iterations are necessary for it to reach a given threshold for magnitude. Different colours are used to distinguish between points that escape to infinity and those that remain constrained inside a certain range.
Algorithm
Step 1 Define the final image's width and height.
Step 2 To change the fractal's position and magnification, alter the zoom level, x, and y offsets.
Step 3 Specify the escape threshold and the maximum number of iterations.
Step 4 The 'julia_fractal()' function should be called with the specified arguments.
Step 5 Use the command 'plt.show()' to see the Julia fractal that was built.
Approach
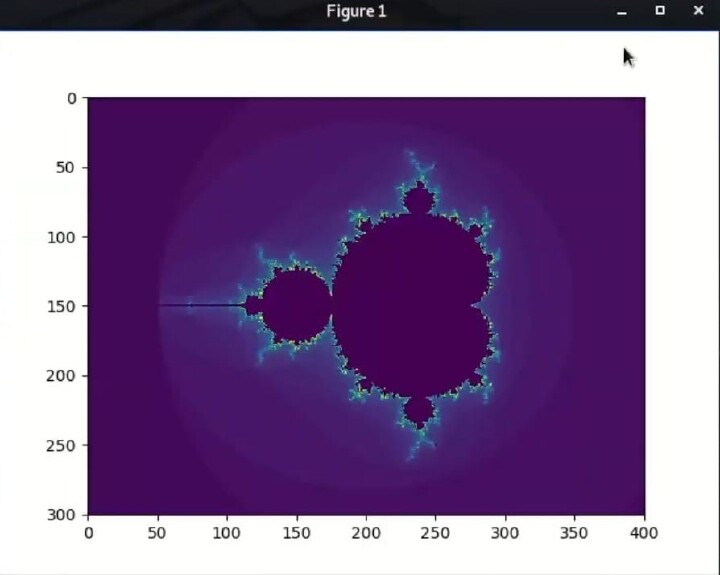
Approach 1 Generating an image of the Mandelbrot set using the matplotlib library.
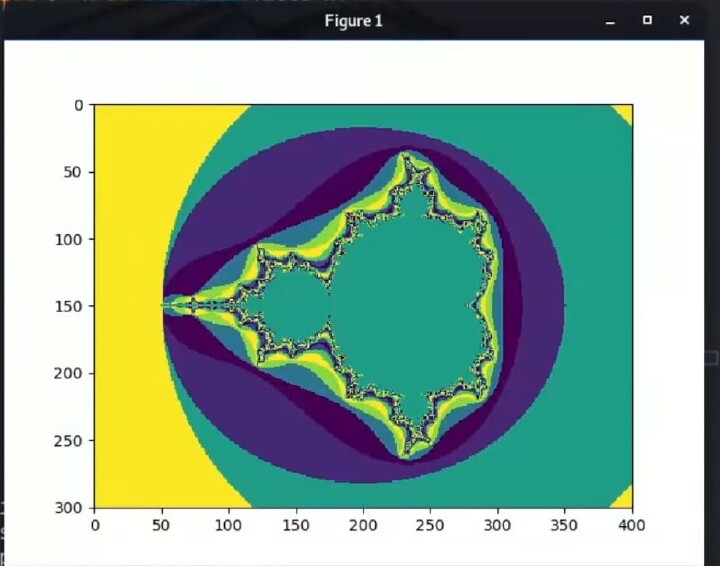
Approach 2 Generating an image of the Mandelbrot set using the matplotlib library using sine function.
Approach 1: Generating an image of the Mandelbrot set using the matplotlib library
Example
import numpy as np
from matplotlib import pyplot as plt
image_x = 400
image_y = 300
mesh_x = np.linspace(-2.5,1.5, num= image_x + 1)
mesh_y = np.linspace(-1.5,1.5, num= image_y + 1)
image = np.zeros((len(mesh_y), len(mesh_x)))
for i,y in enumerate(mesh_y):
   for j, x in enumerate(mesh_x):
      cr, ci = x,y
	  zr, zi = 0,0
	  count = 0
	  color = ?black'
	  while count<= 50:
	     count = count + 1
		 z_mod_sq = zr*zr + zi*zi
		 if z_mod_sq > 4:
		    color = ?white'
			break
		 #zr + I zi = zr^2 - zi^2=2zrziI+ cr +I ci
		 zr, zi = (zr*zr - zi*zi + cr), (2*zr*zi + ci)
	   if color != ?white':
	      image[i][j] = 1
	   else:
	      image[i][j] = count
plt.imshow(image)
plt.show()
Output

The Mandelbrot Set, a well-known mathematical fractal, is implemented in the code. Iteratively applying a function to complex numbers and determining whether the outcome escapes to infinity or remains bounded produces the Mandelbrot Set. Each pixel in the image is represented by a complex integer on the complex plane in this code. For each pixel, the algorithm determines if the iterated function may reach infinity within a predetermined number of iterations (50 in this example). The relevant pixel is coloured white if the function succeeds; otherwise, it is coloured black. The outcome shows the complex and repetitive patterns of the Mandelbrot Set.
Approach 2: Generating an image of the Mandelbrot set using the matplotlib library using sine function
Example
import numpy as np
from matplotlib import pyplot as plt
image_x = 400
image_y = 300
mesh_x = np.linspace(-2.5,1.5, num= image_x + 1)
mesh_y = np.linspace(-1.5,1.5, num= image_y + 1)
image = np.zeros((len(mesh_y), len(mesh_x)))
for i,y in enumerate(mesh_y):
   for j, x in enumerate(mesh_x):
      cr, ci = x,y
	  zr, zi = 0,0
	  count = 0
	  color = 'black'
	  while count<= 50:
         count = count + 1
		 z_mod_sq = zr*zr + zi*zi
		 if z_mod_sq > 4:
		    color = 'white'
			break
		 #zr + I zi = zr^2 - zi^2=2zrziI+ cr +I ci
		 zr, zi = (zr*zr - zi*zi + cr), (2*zr*zi + ci)
	  if color != ?white':
	     image[i][j] = 1
      else:
	     import math
		 image[i][j] = int(math.sin(count) * 10)
plt.imshow(image)
plt.show()
Output

The Mandelbrot Set is still implemented in the code, albeit with a minor change to the colour assignment for pixels that do not reach infinity. The changed code assigns various shades of grey to these pixels based on the value of the iteration count rather than using a binary black-and-white colour scheme. To create a range of grey values, the count value is multiplied by 10 and then sent via a sine function. This turns the Mandelbrot Set into a visually beautiful grayscale representation, emphasising the fine features of the fractal.
The ongoing code now gives pixels a grayscale value based on the number of iterations, giving the image a gradient look. The rewritten code employs the sine function to translate the iteration count to a value between -1 and 1, as opposed to simply using binary black and white colours. After being multiplied by 10 and made into an integer, this value produces a variety of grey colours. By highlighting the various degrees of deviation from the Mandelbrot Set visually, this update aims to produce a more nuanced and aesthetically pleasing image.
Conclusion
Julia fractals provide an enthralling window into the limitless complexity and exquisiteness of mathematics. In this tutorial, we looked at Julia fractals as a concept and learnt how to make them with Python. The Julia fractal function was defined, its syntax was explained, and a step-by-step algorithm for producing Julia fractals was presented. Additionally, we provided two distinct methods with executable code and results. You may produce a variety of captivating Julia fractal patterns by playing with different settings, including zoom, offsets, maximum iterations, escape threshold, and constant values. Real-time investigation is made possible by the interactive method, which promotes a deeper comprehension of the underlying mathematical ideas and the distinctive qualities of Julia fractals.
Python offers a potent environment for creating and displaying fractals because of its extensive scientific libraries, including NumPy and Matplotlib. So plunge into the world of Julia fractals, let your imagination run wild, and set out on an everlasting adventure through the limitless splendour of fractal geometry.

