
Article Categories
- All Categories
-
 Data Structure
-
 Networking
-
 RDBMS
RDBMS
-
 Operating System
-
 Java
Java
-
 MS Excel
-
 iOS
iOS
-
 HTML
HTML
-
 CSS
CSS
-
 Android
-
 Python
-
 C Programming
-
 C++
C++
-
 C#
C#
-
 MongoDB
-
 MySQL
MySQL
-
 Javascript
-
 PHP
PHP
-
 Economics & Finance
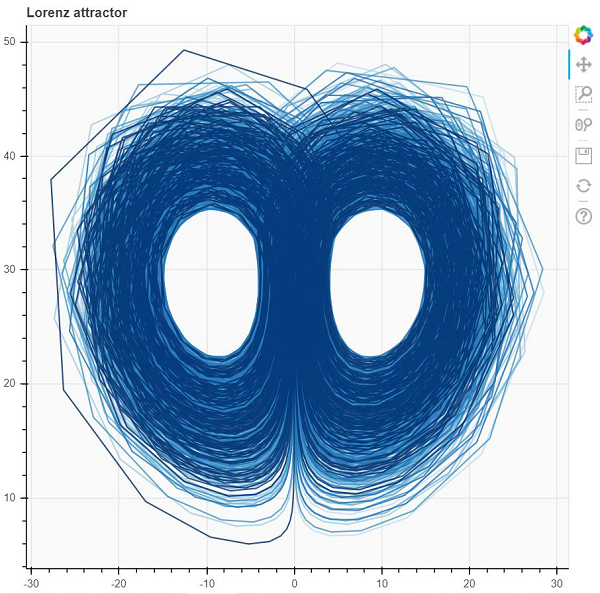
How to visualize a multi-line graph, such as Lorentz attractor in Bokeh?
Bokeh is a Python package that helps in data visualization. It is an open source project. Bokeh renders its plot using HTML and JavaScript. This indicates that it is useful while working with web−based dashboards.
Bokeh converts the data source into a JSON file. This file is used as an input to BokehJS, which is a JavaScript library. This BokehJS is written in TypeScript that helps render visualization on modern browsers.
Matplotlib and Seaborn produce static plots, whereas Bokeh produces interactive plots. This means when the user interacts with these plots, they change accordingly.
Dependencies of Bokeh −
Numpy
Pillow
Jinja2
Packaging
Pyyaml
Six
Tornado
Python−dateutil
Installation of Bokeh on Windows command prompt
pip3 install bokeh
Installation of Bokeh on Anaconda prompt
conda install bokeh
Following is the code −
Example
import numpy as np
from scipy.integrate import odeint
from bokeh.plotting import figure, output_file, show

sigma = 15
rho = 30
beta = 11/6
theta = 3 * np.pi / 5

def lorenzFun(xyz, t):
   x, y, z = xyz
   x_dot = sigma * (y − x)
   y_dot = x * rho − x * z − y
   z_dot = x * y − beta* z
   return [x_dot, y_dot, z_dot]

initial = (−11, −8, 40)
t = np.arange(0, 1149, 0.05)

solution = odeint(lorenzFun, initial, t)

x = solution[:, 0]
y = solution[:, 1]
z = solution[:, 2]
xprime = np.cos(theta) * x − np.sin(theta) * y
colors = ["#C6DBEF", "#9ECAE1", "#6BAED6", "#4292C6", "#2171B5", "#08306B",]
p = figure(title="Lorenz attractor ", background_fill_color="#fafafa")

p.multi_line(np.array_split(xprime, 6), np.array_split(z, 6),
line_color=colors, line_alpha=0.8, line_width=1.5)
output_file("lorenzplot.html", title="lorenz attractor example")

show(p)
Output
Explanation
The required packages are imported, and aliased.
The figure function is called along with plot width and height.
The ‘lorenzFun’ is defined, that gives values for ‘x’, ‘y’, and ‘z’.
The colors list is defined, that imparts color to the plot.
The ‘output_file’ function is called to mention the name of the html file that will be generated.
The ‘multi_fun’ function present in Bokeh is called, along with data.
The ‘show’ function is used to display the plot.

179 Views
