 Data Structure
 Networking
 RDBMS
RDBMS Operating System
 Java
Java MS Excel
 iOS
iOS HTML
HTML CSS
CSS Android
 Python
 C Programming
 C++
C++ C#
C# MongoDB
 MySQL
MySQL Javascript
 PHP
PHP
- Selected Reading
- UPSC IAS Exams Notes
- Developer's Best Practices
- Questions and Answers
- Effective Resume Writing
- HR Interview Questions
- Computer Glossary
- Who is Who
How to view the parameters in axes_style in Seaborn?
Seaborn's 'axes_style()' function allows us to customize the style of plots by modifying various parameters. It returns a dictionary of parameters that control the appearance of the plot elements, such as colors, fonts, gridlines, and more. To view these parameters, we can print the dictionary returned by 'axes_style()'.
Importing Required Libraries
Before we begin, let's import the necessary libraries. We need to import Seaborn by using the following command.
import seaborn as sns
Viewing Parameters
To view the available parameters in 'axes_style()', we can simply print the dictionary returned by the function.
Example
When we run the below code, it will print a dictionary containing the default parameter values for the current style.
import seaborn as sns
# Print the parameters in axes_style
print(sns.axes_style())
Output
{'axes.facecolor': 'white', 'axes.edgecolor': '.15', 'axes.grid': False, 'axes.axisbelow': True, 'axes.labelcolor': '.15', 'figure.facecolor': 'white', 'grid.color': '.8', 'grid.linestyle': '-', 'text.color': '.15', 'xtick.color': '.15', 'ytick.color': '.15', 'xtick.direction': 'out', 'ytick.direction': 'out', 'lines.solid_capstyle': , 'patch.edgecolor': 'w', 'patch.force_edgecolor': True, 'image.cmap': 'rocket', 'font.family': ['sans-serif'], 'font.sans-serif': ['Arial', 'DejaVu Sans', 'Liberation Sans', 'Bitstream Vera Sans', 'sans-serif'], 'xtick.bottom': True, 'xtick.top': False, 'ytick.left': True, 'ytick.right': False, 'axes.spines.left': True, 'axes.spines.bottom': True, 'axes.spines.right': True, 'axes.spines.top': True}
The output dictionary contains various parameters that define the style of different plot elements. Among them let's go through some common parameters.
''axes.facecolor'' ? The background color of the axes.
''axes.edgecolor'' ? The color of the axes' edges.
''axes.grid'' ? Whether to display gridlines in the plot.
''axes.axisbelow'' ? Whether the gridlines are drawn below the plot elements.
''axes.labelcolor'' ? The color of the axis labels.
''figure.facecolor'' ? The background color of the figure.
These are just a few examples, and there are many more parameters available that control different aspects of plot appearance.
Applying a Style and Viewing Parameters
To see the parameters for a specific style, we can apply that style using 'sns.set_style()' and then print the dictionary returned by 'sns.axes_style()'.
By applying a specific style using 'sns.set_style()', we can see the parameters specific to that style. For instance, if we set the style to ''darkgrid'', the printed dictionary will contain the parameters for the 'darkgrid' style.
Example
import seaborn as sns

# Apply a style
sns.set_style('darkgrid')
# Print the parameters in axes_style for the applied style
print(sns.axes_style())
Output
{'axes.facecolor': '#EAEAF2', 'axes.edgecolor': 'white', 'axes.grid': True, 'axes.axisbelow': True, 'axes.labelcolor': '.15', 'figure.facecolor': 'white', 'grid.color': 'white', 'grid.linestyle': '-', 'text.color': '.15', 'xtick.color': '.15', 'ytick.color': '.15', 'xtick.direction': 'out', 'ytick.direction': 'out', 'lines.solid_capstyle': , 'patch.edgecolor': 'w', 'patch.force_edgecolor': True, 'image.cmap': 'rocket', 'font.family': ['sans-serif'], 'font.sans-serif': ['Arial', 'DejaVu Sans', 'Liberation Sans', 'Bitstream Vera Sans', 'sans-serif'], 'xtick.bottom': False, 'xtick.top': False, 'ytick.left': False, 'ytick.right': False, 'axes.spines.left': True, 'axes.spines.bottom': True, 'axes.spines.right': True, 'axes.spines.top': True}
Customizing Plot Style Using Parameters
Once we have viewed the available parameters, we can use them to customize the plot style. To modify a specific parameter, we can pass it as an argument to 'sns.set_style()'.
Example
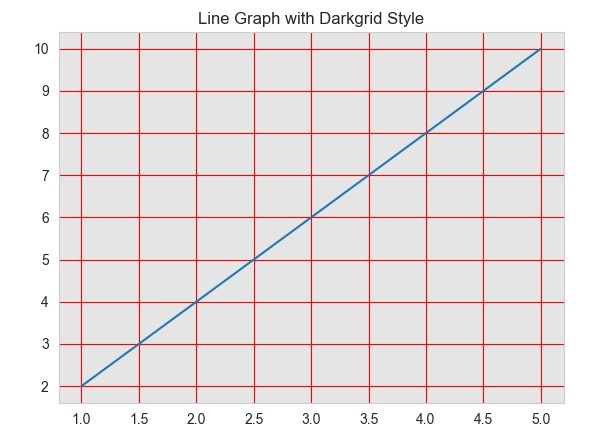
In this example, we customize the plot style by passing a dictionary of parameters as the second argument to 'sns.set_style()'. We set the ''axes.facecolor'' parameter to a light gray color, the ''grid.color'' parameter to red, and the ''axes.labelcolor'' parameter to blue.
import seaborn as sns
import matplotlib.pyplot as plt

# Generate some random data for plotting
x = [1, 2, 3, 4, 5]
y = [2, 4, 6, 8, 10]


# Set the style to "darkgrid"
sns.set_style("darkgrid")

# Customize the plot style using parameters
sns.set_style(
   'whitegrid',
   {'axes.facecolor': '#E5E5E5', 'grid.color': 'red', 'axes.labelcolor': 'blue'}
)

# Plot a line graph using the darkgrid style
plt.plot(x, y)
plt.title("Line Graph with Darkgrid Style")
plt.show()
Output


