
Article Categories
- All Categories
-
 Data Structure
-
 Networking
-
 RDBMS
RDBMS
-
 Operating System
-
 Java
Java
-
 MS Excel
-
 iOS
iOS
-
 HTML
HTML
-
 CSS
CSS
-
 Android
-
 Python
-
 C Programming
-
 C++
C++
-
 C#
C#
-
 MongoDB
-
 MySQL
MySQL
-
 Javascript
-
 PHP
PHP
Selected Reading
How to handle times with a time zone in Matplotlib?
To handle times with a time zone in Matplotlib, we can take the following steps −
- Set the figure size and adjust the padding between and around the subplots.
- Create a dataframe, i.e., two-dimensional, size-mutable, potentially heterogeneous tabular data.
- To handle times with a time zone, use pytz library that brings the Olson tz database into Python. This library allows accurate and cross-platform timezone calculations.
- Plot the dataframe using plot() method.
- To display the figure, use show() method.
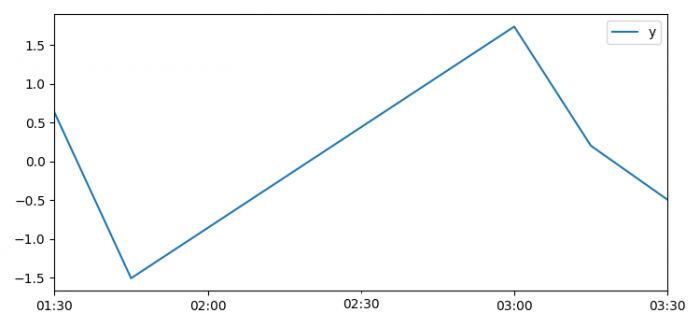
Example
import pandas as pd
import numpy as np
from matplotlib import pyplot as plt
import pytz

plt.rcParams["figure.figsize"] = [7.50, 3.50]
plt.rcParams["figure.autolayout"] = True

df = pd.DataFrame(
   dict(y=np.random.normal(size=5)),
      index=pd.date_range(
      start='2018-03-11 01:30',
      freq='15min',
      periods=5,
      tz=pytz.timezone('US/Eastern')))
df.plot()

plt.show()
Output

Updated on: 2021-06-17T12:09:06+05:30
554 Views

Advertisements