
Article Categories
- All Categories
-
 Data Structure
-
 Networking
-
 RDBMS
RDBMS
-
 Operating System
-
 Java
Java
-
 MS Excel
-
 iOS
iOS
-
 HTML
HTML
-
 CSS
CSS
-
 Android
-
 Python
-
 C Programming
-
 C++
C++
-
 C#
C#
-
 MongoDB
-
 MySQL
MySQL
-
 Javascript
-
 PHP
PHP
-
 Economics & Finance
Selected Reading
How to deal with the error "Error in int_abline---plot.new has not been called yet" in R?
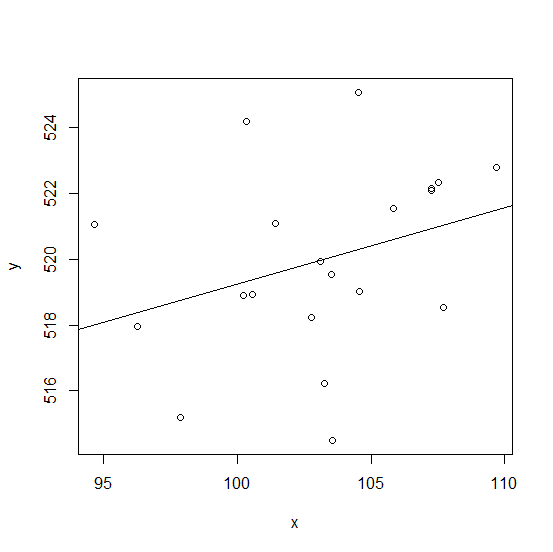
The above error means plot is not being created yet hence abline function cannot be used to draw anything on the plot. Therefore, a plot needs to be created first to use abline function for creating a line or any other thing. Mostly, abline is used to create regression line on the plot, thus we need to create a scatterplot first before using abline.
Example
abline(lm(y~x))
Output

Updated on: 2026-03-11T23:22:53+05:30
5K+ Views

Advertisements