 Data Structure
 Networking
 RDBMS
RDBMS Operating System
 Java
Java MS Excel
 iOS
iOS HTML
HTML CSS
CSS Android
 Python
 C Programming
 C++
C++ C#
C# MongoDB
 MySQL
MySQL Javascript
 PHP
PHP
- Selected Reading
- UPSC IAS Exams Notes
- Developer's Best Practices
- Questions and Answers
- Effective Resume Writing
- HR Interview Questions
- Computer Glossary
- Who is Who
How to Change the vertical spacing between legend entries in Matplotlib?
Legends play a crucial role in conveying information about plotted elements which are mainly contained in the matplotlib which is a popular Python library used for data visualization but sometimes when dealing with complex visualizations, the default vertical spacing between legend entries may not be ideal. This article explores techniques to modify and customize the vertical spacing between legend entries in Matplotlib, allowing users to enhance the readability and aesthetic appeal of their plots.
What is a legend in a Matpltlib graph?
In a Matplotlib graph, a legend is a key or a guide that provides an explanation for the various elements displayed in the plot. It helps identify the meaning of different colors, markers, or line styles used in the plot. The legend typically includes labels or symbols associated with each element and their corresponding descriptions. It allows the viewer to understand the representation of data or categories within the plot. The legend is a valuable component in conveying information and improving the interpretability of the graph.
How to change the vertical spacing between legend entries in Matplotlib?
To change the vertical spacing between legend entries in Matplotlib, you can follow these steps ?
Import the required libraries ?
import matplotlib.pyplot as plt
Create a plot and add the legend ?
# Plotting code...
plt.legend()
Get the legend handles and labels ?
handles, labels = plt.gca().get_legend_handles_labels()
Create a new legend with modified vertical spacing ?
# Specify the desired vertical spacing (adjust the value as needed)
spacing = 1.0

# Create a new legend with modified spacing
new_legend = plt.legend(handles, labels, loc='upper right', ncol=1, frameon=False, bbox_to_anchor=(1.1, 1.1), title='Legend', borderpad=spacing)
In the code above, spacing is a variable representing the desired vertical spacing between legend entries. You can adjust this value according to your needs. The bbox_to_anchor parameter sets the position of the legend, and you can modify its coordinates to position it appropriately within your plot.
Remove the old legend ?
# Remove the old legend
plt.gca().get_legend().remove()
Add the new legend to the plot ?
# Add the new legend to the plot
plt.gca().add_artist(new_legend)
Display the plot ?
plt.show()
By following these steps, you can customize the vertical spacing between legend entries in Matplotlib according to your preference.
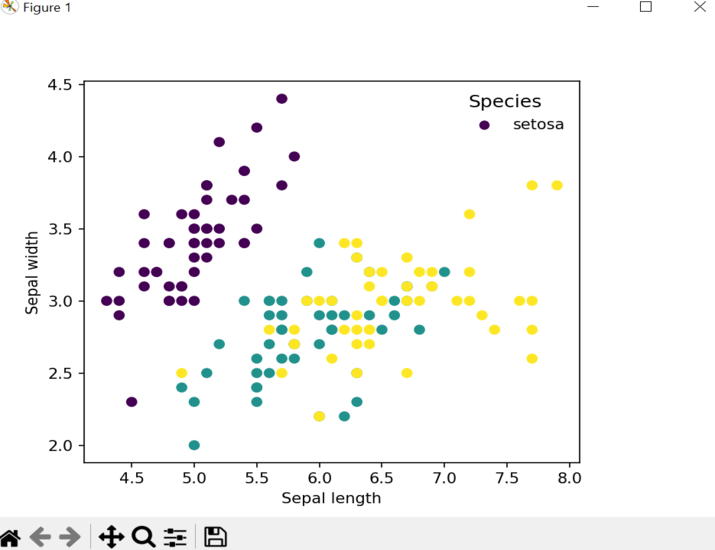
Below is the program example of How to Change the vertical spacing between legend entries in Matplotlib using the iris dataset with scatter plot ?
Example
import matplotlib.pyplot as plt
import numpy as np

# Load an example dataset (Iris dataset)
from sklearn.datasets import load_iris
iris = load_iris()
X = iris.data
y = iris.target
target_names = iris.target_names

# Plotting the data
plt.scatter(X[:, 0], X[:, 1], c=y)
plt.xlabel('Sepal length')
plt.ylabel('Sepal width')

# Create a legend with custom vertical spacing
legend = plt.legend(target_names, title='Species', loc='lower right')

# Set the vertical spacing between legend entries
legend.get_frame().set_linewidth(0.0)  # Remove border around the legend
legend.get_title().set_fontsize('12')  # Set the font size of the legend title
for handle in legend.legendHandles:
   handle.set_sizes([30])  # Set the marker size of the legend entries
legend._legend_box.align = "left"  # Align legend entries vertically

# Adjust the vertical spacing between legend entries
legend._set_loc(1)
plt.subplots_adjust(right=0.8)

# Display the plot
plt.show()
Output

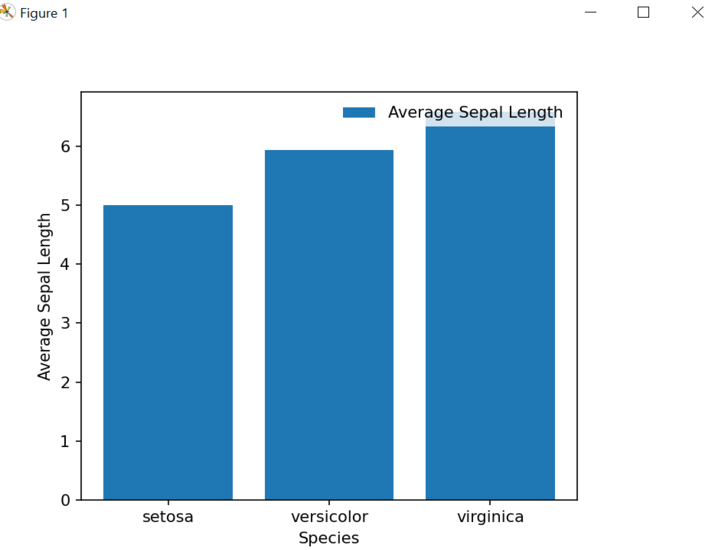
To change the vertical spacing between legend entries, we access the legend properties using legend.get_frame(), legend.get_title(), and legend.legendHandles. We remove the border around the legend, set the font size of the legend title, set the marker size of the legend entries, and align the legend entries vertically. The legend._set_loc(1) line adjusts the vertical spacing, and plt.subplots_adjust() is used to adjust the layout of the plot.
Below is the program example of How to Change the vertical spacing between legend entries in Matplotlib using the iris dataset with bar graph ?
Example
import matplotlib.pyplot as plt
import numpy as np

# Load an example dataset (Iris dataset)
from sklearn.datasets import load_iris
iris = load_iris()
X = iris.data
y = iris.target
target_names = iris.target_names

# Calculate the average sepal length for each species
avg_sepal_length = []
for i in range(len(target_names)):
   avg_sepal_length.append(np.mean(X[y == i, 0]))

# Plotting the data
plt.bar(target_names, avg_sepal_length)
plt.xlabel('Species')
plt.ylabel('Average Sepal Length')

# Create a legend with custom vertical spacing
legend = plt.legend(['Average Sepal Length'], loc='upper right')

# Set the vertical spacing between legend entries
legend.get_frame().set_linewidth(0.0)  # Remove border around the legend
legend.get_title().set_fontsize('12')  # Set the font size of the legend title
legend._legend_box.align = "left"  # Align legend entries vertically

# Adjust the vertical spacing between legend entries
legend._set_loc(1)
plt.subplots_adjust(right=0.8)

# Display the plot
plt.show()
Output

Conclusion
In conclusion, changing the vertical spacing between legend entries in Matplotlib can be achieved by accessing and modifying the properties of the legend object. By removing the legend's border, adjusting the font size of the title, and aligning the legend entries vertically, we can customize the spacing according to our preferences. This allows for better control over the layout and presentation of the legend in the plot. By employing these techniques, we can enhance the clarity and visual appeal of our graphs, making them more informative and engaging for the audience.

