
Article Categories
- All Categories
-
 Data Structure
-
 Networking
-
 RDBMS
RDBMS
-
 Operating System
-
 Java
Java
-
 MS Excel
-
 iOS
iOS
-
 HTML
HTML
-
 CSS
CSS
-
 Android
-
 Python
-
 C Programming
-
 C++
C++
-
 C#
C#
-
 MongoDB
-
 MySQL
MySQL
-
 Javascript
-
 PHP
PHP
-
 Economics & Finance
Selected Reading
How to rotate xticklabels in Matplotlib so that the spacing between each xticklabel is equal?
To rotate xticklabels in matplotlib to make equal spacing between two xticklabels, we can take the following steps −
Make a list of numbers from 1 to 4.
Using subplot(), sdd a subplot to the current figure.
Add xticks and yticks on the current subplot (using step 1).
Set xtick labels by passing a list and to make label rotation (= 45).
To display the figure, use show() method.
Example
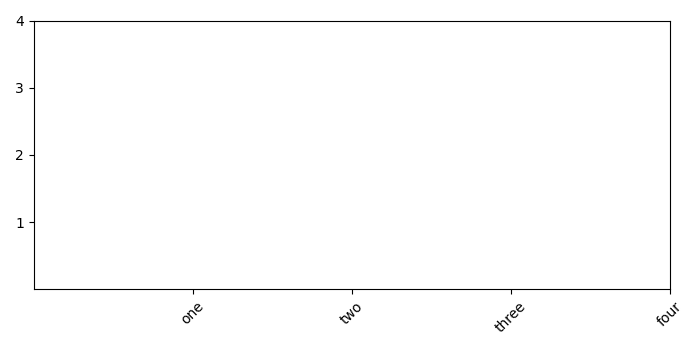
import matplotlib.pyplot as plt
plt.rcParams["figure.figsize"] = [7.00, 3.50]
plt.rcParams["figure.autolayout"] = True
x = [1, 2, 3, 4]
ax1 = plt.subplot()
ax1.set_xticks(x)
ax1.set_yticks(x)
ax1.set_xticklabels(["one", "two", "three", "four"], rotation=45)
plt.show()
Output

Updated on: 2021-05-06T13:01:04+05:30
444 Views

Advertisements