 Data Structure
 Networking
 RDBMS
RDBMS Operating System
 Java
Java MS Excel
 iOS
iOS HTML
HTML CSS
CSS Android
 Python
 C Programming
 C++
C++ C#
C# MongoDB
 MySQL
MySQL Javascript
 PHP
PHP
- Selected Reading
- UPSC IAS Exams Notes
- Developer's Best Practices
- Questions and Answers
- Effective Resume Writing
- HR Interview Questions
- Computer Glossary
- Who is Who
How To Calculate Studentized Residuals In Python?
Studentized residuals are typically used in regression analysis to identify potential outliers in the data. An outlier is a point that is significantly different from the overall trend of the data, and it can have a significant influence on the fitted model. By identifying and analyzing outliers, you can better understand the underlying patterns in your data and improve the accuracy of your model. In this post, we will be closely looking at Studentized Residuals and how you can implement it in python.
What are Studentized Residuals?
The term "studentized residuals" refers to a particular class of residuals that have had their standard deviations divided by an estimate. Regression analysis residuals are used to describe the discrepancy between the response variable's observed values and its model-generated anticipated values. To find probable outliers in the data that can significantly affect the fitted model, studentized residuals are employed.
The following formula is typically used to calculate studentized residuals ?
studentized residual = residual / (standard deviation of residuals * (1 - hii)^(1/2))
where "residual" refers to the discrepancy between the observed and anticipated response values, "standard deviation of residuals" refers to an estimate of the residuals' standard deviation, and "hii" refers to the leverage factor for each data point.
Calculating Studentized Residuals in Python
The statsmodels package can be used to compute studentized residuals in Python. As an illustration, consider the following ?
Syntax
OLSResults.outlier_test()
Where OLSResults refers to a linear model that was fitted using statsmodels' ols() method.
df = pd.DataFrame({'rating': [95, 82, 92, 90, 97, 85, 80, 70, 82, 83],
   'points': [22, 25, 17, 19, 26, 24, 9, 19, 11, 16]})

model = ols('rating ~ points', data=df).fit()
stud_res = model.outlier_test()
Where ?rating' and ?points' refers to the simple linear regression.
Algorithm
Import numpy, pandas, Statsmodel apis.
Create a dataset.
Perform a simple linear regression model on dataset.
Calculating studentized residuals.
Printing studentized residuals.
Example
Using the scikit?posthocs lib to run Dunn's test is demonstrated here ?
#import necessary packages and functions
import numpy as np
import pandas as pd
import statsmodels.api as sm
from statsmodels.formula.api import ols

#create dataset
df = pd.DataFrame({'rating': [95, 82, 92, 90, 97, 85, 80, 70, 82, 83], 'points': [22, 25, 17, 19, 26, 24, 9, 19, 11, 16]})
Create a linear regression model next by using the statsmodels OLS class ?
#fit simple linear regression model
model = ols('rating ~ points', data=df).fit()
Using the outlier test() method, the studentized residuals for each observation in the dataset can be generated in a DataFrame ?
#calculate studentized residuals
stud_res = model.outlier_test()

#display studentized residuals
print(stud_res)
Output
  student_resid   unadj_p   bonf(p)
0       1.048218  0.329376  1.000000
1      -1.018535  0.342328  1.000000
2       0.994962  0.352896  1.000000
3       0.548454  0.600426  1.000000
4       1.125756  0.297380  1.000000
5      -0.465472  0.655728  1.000000
6      -0.029670  0.977158  1.000000
7      -2.940743  0.021690  0.216903
8       0.100759  0.922567  1.000000
9      -0.134123  0.897080  1.000000
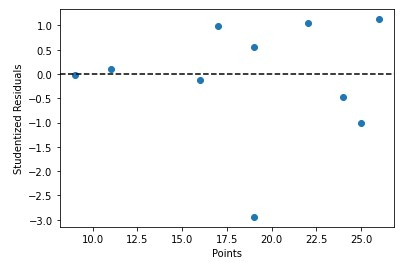
We can also quickly plot the predictor variable values against the studentized residuals ?
Syntax
x = df['points']
y = stud_res['student_resid']

plt.scatter(x, y)
plt.axhline(y=0, color='black', linestyle='--')
plt.xlabel('Points')
plt.ylabel('Studentized Residuals')
Here we will be using matpotlib library to plot the graph with color = ?black' and lifestyle = ?--'
Algorithm
Importing matplotlib's pyplot library
Defining predictor variable values
Defining studentized residuals
Creating scatterplot of predicotr variable vs. studentized residuals
Example
import matplotlib.pyplot as plt

#define predictor variable values and studentized residuals
x = df['points']
y = stud_res['student_resid']

#create scatterplot of predictor variable vs. studentized residuals
plt.scatter(x, y)
plt.axhline(y=0, color='black', linestyle='--')
plt.xlabel('Points')
plt.ylabel('Studentized Residuals')
Output

Conclusion
Identifying and evaluating possible data outliers. Examining the studentized residuals allows you to find points that deviate considerably from the overall trend of the data and explore why they are impacting the fitted model. Identifying significant observations Studentized residuals can be used to discover and evaluate influential data, which are points that have a substantial influence on the fitted model. Finding high-leverage spots. The studentized residuals can be used to identify high-leverage points. Leverage is a measure of how much a certain point affects the fitted model. Overall, using studentized residuals can help analyze and enhance the performance of a regression model.

