 Data Structure
 Networking
 RDBMS
RDBMS Operating System
 Java
Java MS Excel
 iOS
iOS HTML
HTML CSS
CSS Android
 Python
 C Programming
 C++
C++ C#
C# MongoDB
 MySQL
MySQL Javascript
 PHP
PHP
- Selected Reading
- UPSC IAS Exams Notes
- Developer's Best Practices
- Questions and Answers
- Effective Resume Writing
- HR Interview Questions
- Computer Glossary
- Who is Who
How do you get the current figure number in Python's Matplotlib?
In this article, we are going to the current figure number in Python's matplotlib.
Matplotlib is a Python library that is a numerical-mathematical extension of the NumPy library. Pyplot is a state-based interface to a Matplotlib module that provides MATLAB-like functionality. Line Plot, Contour, Histogram, Scatter, 3D Plot, and other plots are available in Pyplot.
Using plt.gcf().number
What is plt.gcf()
The matplotlib.pyplot.gcf() function is primarily used to obtain the current figure. One is generated using the figure() function if no current figure is available.
matplotlib.pyplot.gcf()
Algorithm (Steps)
Following are the Algorithm/steps to be followed to perform the desired task ?
Import the pyplot from matplotlib
Pyplot is a Matplotlib module that offers a MATLAB-style interface.
Matplotlib is intended to be as user-friendly as MATLAB, but with
the added benefit of being free and open-source. Each pyplot function
alters a figure in some way, such as creating a figure, creating a
plotting area in a figure, plotting some lines in a plotting area,
decorating the plot with labels, and so on. Pyplot supports the following
plot types: Line Plot, Histogram, Scatter, 3D Plot, Image, Contour, and Polar
Import numpy using the import keyword.
Get the range of values from 0.1 to 2 using the arange() function (NumPy arange() is a numerical range-based array creation routine. It creates an ndarray instance with evenly spaced values and returns a reference to it).
Get the sine values of the above created numpy array and store it in a variable and multiply sine values with 2.
Get the sine values of the above created numpy array and store it in a variable and multiply sine values with 4 to show differentiation
Create a figure using the pyplot by passing the number of figures of an argument to the figure() function(The function plt.figure() is used to create a figure object. The figure object is considered to be the entire figure. When we want to change the size of the figure or add multiple Axes objects in a single figure, we must use plt.figure() explicitly).
Create the plot using the plot() function(To draw points (markers) in a diagram, use the plot() function.The plot() function draws a line from point to point by default.The function accepts parameters for specifying diagram points.The first parameter is an array of x-axis points.Parameter 2 is an array containing the y-axis points).Here we took arange values as x-axis and sine values as y-axis.
Create another figure with different sine values
Get the current figure number using the number attribute of the plt.gcf() function
Print the current figure number.
show the plots using the show() function(plt.show() initiates an event loop, searches for all currently active figure objects, and displays your figure or figures in one or more interactive windows).
The following program returns the current figure number in Python's matplotlib using the plt.gcf().number ?
# Importing pyplot from matplotlib as plt using the alias(as) keyword
from matplotlib import pyplot as plt
import numpy as np

# Taking sine values as numpy array
t = np.arange(0.1, 2.0)

# Sine curves
sineValues1 = np.sin(2*np.pi*t)
sineValues2 = np.sin(4*np.pi*t)

# Creating a numpy figure
plt.figure(1)

# Plotting the figure by passing sine curve values
plt.plot(t, sineValues1)

# Creating second numpy figure
plt.figure(2)

# Plotting the second figure by passing another sine curve values
plt.plot(t, sineValues2)

# Getting the current Figure number using gcf().number attribute
currentFigureNumber = plt.gcf().number

# Printing current figure number
print("Current Figure Number: ", currentFigureNumber)

# Showing the plots
plt.show()

# Importing pyplot from matplotlib as plt using the alias(as) keyword
from matplotlib import pyplot as plt
import numpy as np

# Taking sine values as numpy array
t = np.arange(0.1, 2.0)

# Sine curves
sineValues1 = np.sin(2*np.pi*t)
sineValues2 = np.sin(4*np.pi*t)

# Creating a numpy figure
plt.figure(1)

# Plotting the figure by passing sine curve values
plt.plot(t, sineValues1)

# Creating second numpy figure
plt.figure(2)

# Plotting the second figure by passing another sine curve values
plt.plot(t, sineValues2)

# Getting the current Figure number using gcf().number attribute
currentFigureNumber = plt.gcf().number

# Printing current figure number
print("Current Figure Number: ", currentFigureNumber)

# Showing the plots
plt.show()
Output
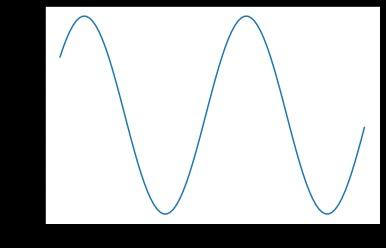
On executing, the above program will generate the following output ?


Because we recently created the second figure, the current working figure is 2.
Note
You can also make figures out of text strings rather than numbers, such as plt.figure ("first"). When switching between figures, this may be easier to remember than numbers. Still, plt.gcf().number returns the integer "1," indicating that it is an automatic numbering system.
Conclusion
In this article, we learned how to get the current figure number in matplotlib. We also learned what matplotlib is, how to create figures while plotting, how to get figures using the gcf() function, and so on.

