
Article Categories
- All Categories
-
 Data Structure
-
 Networking
-
 RDBMS
RDBMS
-
 Operating System
-
 Java
Java
-
 MS Excel
-
 iOS
iOS
-
 HTML
HTML
-
 CSS
CSS
-
 Android
-
 Python
-
 C Programming
-
 C++
C++
-
 C#
C#
-
 MongoDB
-
 MySQL
MySQL
-
 Javascript
-
 PHP
PHP
-
 Economics & Finance
Selected Reading
How do I make sans serif superscript or subscript text in Matplotlib?
To make superscript or subscript text in matplotlib, use LaTeX representation.
Steps
Create x and y data points using numpy.
Plot x and y data point using plot() method.
Put the title with LateX representation using title() method.
Use xlabel and ylabel methods to set the label of the axes.
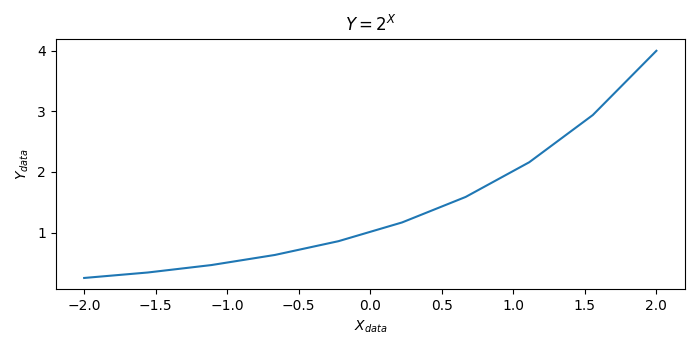
Example
import numpy as np
from matplotlib import pyplot as plt
plt.rcParams["figure.figsize"] = [7.00, 3.50]
plt.rcParams["figure.autolayout"] = True
x = np.linspace(-2, 2, 10)
y = 2**x
plt.plot(x, y)
plt.title('$Y=2^{X}$')
plt.xlabel('$X_{data}$')
plt.ylabel('$Y_{data}$')
plt.show()
Output

Updated on: 2021-05-08T08:38:43+05:30
2K+ Views

Advertisements