
Article Categories
- All Categories
-
 Data Structure
-
 Networking
-
 RDBMS
RDBMS
-
 Operating System
-
 Java
Java
-
 MS Excel
-
 iOS
iOS
-
 HTML
HTML
-
 CSS
CSS
-
 Android
-
 Python
-
 C Programming
-
 C++
C++
-
 C#
C#
-
 MongoDB
-
 MySQL
MySQL
-
 Javascript
-
 PHP
PHP
-
 Economics & Finance
How can Tensorflow and pre-trained model be used to understand the learning curve?
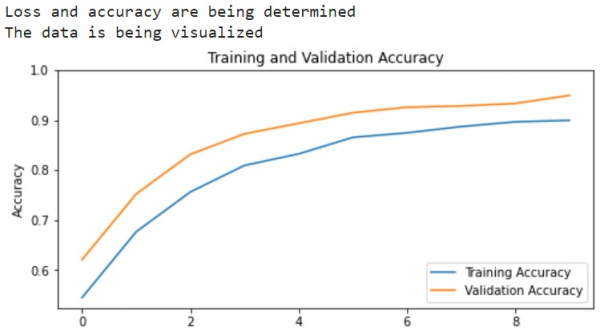
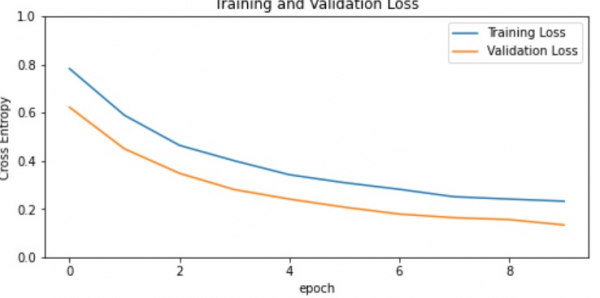
Tensorflow and the pre-trained model can be used to understand the learning curve by visualizing the operations that are performed on input dataset. The training accuracy, and validation accuracy are plotted with the help of the ‘matplotlib’ library. The training loss and validation loss are also visualized.
Read More: What is TensorFlow and how Keras work with TensorFlow to create Neural Networks?
A neural network that contains at least one layer is known as a convolutional layer. We can use the Convolutional Neural Network to build learning model.
We will understand how to classify images of cats and dogs with the help of transfer learning from a pre-trained network. The intuition behind transfer learning for image classification is, if a model is trained on a large and general dataset, this model can be used to effectively serve as a generic model for the visual world. It would have learned the feature maps, which means the user won’t have to start from scratch by training a large model on a large dataset.
Read More: How can a customized model be pre-trained?
We are using the Google Colaboratory to run the below code. Google Colab or Colaboratory helps run Python code over the browser and requires zero configuration and free access to GPUs (Graphical Processing Units). Colaboratory has been built on top of Jupyter Notebook.
Example
print("Loss and accuracy are being determined")
acc = history.history['accuracy']
val_acc = history.history['val_accuracy']
loss = history.history['loss']
val_loss = history.history['val_loss']
print("The data is being visualized")
plt.figure(figsize=(8, 8))
plt.subplot(2, 1, 1)
plt.plot(acc, label='Training Accuracy')
plt.plot(val_acc, label='Validation Accuracy')
plt.legend(loc='lower right')
plt.ylabel('Accuracy')
plt.ylim([min(plt.ylim()),1])
plt.title('Training and Validation Accuracy')
plt.subplot(2, 1, 2)
plt.plot(loss, label='Training Loss')
plt.plot(val_loss, label='Validation Loss')
plt.legend(loc='upper right')
plt.ylabel('Cross Entropy')
plt.ylim([0,1.0])
plt.title('Training and Validation Loss')
plt.xlabel('epoch')
plt.show()
Code credit −https://www.tensorflow.org/tutorials/images/transfer_learning
Output
Explanation
The learning curves of the training and validation accuracy/loss is visualized.
This is done using MobileNet V2 base model as a fixed feature extractor.

375 Views
