- H2O - Home
- H2O - Introduction
- H2O - Installation
- H2O - Flow
- H2O - Running Sample Application
- H2O - AutoML
- H2O Useful Resources
- H2O - Quick Guide
- H2O - Useful Resources
- H2O - Discussion
H2O - AutoML
To use AutoML, start a new Jupyter notebook and follow the steps shown below.
Importing AutoML
First import H2O and AutoML package into the project using the following two statements −
import h2o
from h2o.automl import H2OAutoML
Initialize H2O
Initialize h2o using the following statement −
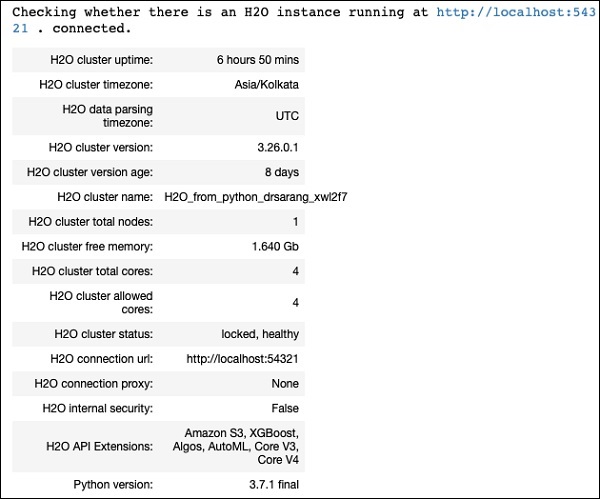
h2o.init()
You should see the cluster information on the screen as shown in the screenshot below −
Loading Data
We will use the same iris.csv dataset that you used earlier in this tutorial. Load the data using the following statement −
data = h2o.import_file('iris.csv')
Preparing Dataset
We need to decide on the features and the prediction columns. We use the same features and the predication column as in our earlier case. Set the features and the output column using the following two statements −
features = ['sepal_length', 'sepal_width', 'petal_length', 'petal_width']
output = 'class'
Split the data in 80:20 ratio for training and testing −
train, test = data.split_frame(ratios=[0.8])
Applying AutoML
Now, we are all set for applying AutoML on our dataset. The AutoML will run for a fixed amount of time set by us and give us the optimized model. We set up the AutoML using the following statement −
aml = H2OAutoML(max_models = 30, max_runtime_secs=300, seed = 1)
The first parameter specifies the number of models that we want to evaluate and compare.
The second parameter specifies the time for which the algorithm runs.
We now call the train method on the AutoML object as shown here −
aml.train(x = features, y = output, training_frame = train)
We specify the x as the features array that we created earlier, the y as the output variable to indicate the predicted value and the dataframe as train dataset.
Run the code, you will have to wait for 5 minutes (we set the max_runtime_secs to 300) until you get the following output −

Printing the Leaderboard
When the AutoML processing completes, it creates a leaderboard ranking all the 30 algorithms that it has evaluated. To see the first 10 records of the leaderboard, use the following code −
lb = aml.leaderboard
lb.head()
Upon execution, the above code will generate the following output −
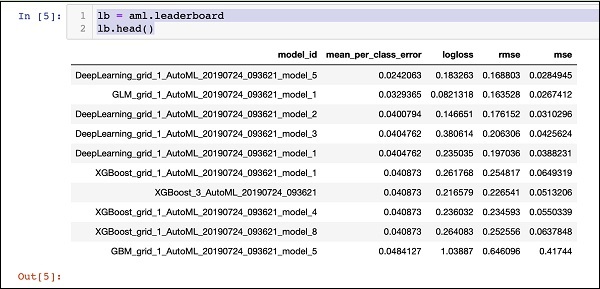
Clearly, the DeepLearning algorithm has got the maximum score.
Predicting on Test Data
Now, you have the models ranked, you can see the performance of the top-rated model on your test data. To do so, run the following code statement −
preds = aml.predict(test)
The processing continues for a while and you will see the following output when it completes.

Printing Result
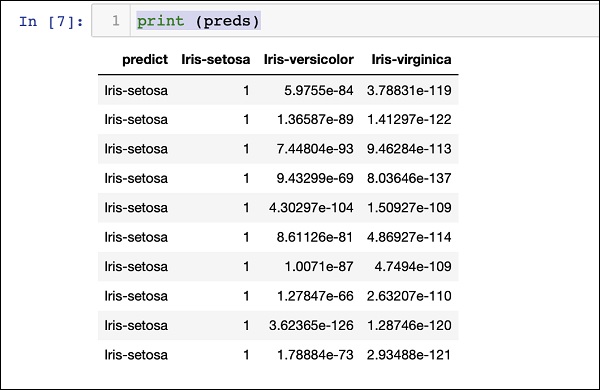
Print the predicted result using the following statement −
print (preds)
Upon execution of the above statement, you will see the following result −
Printing the Ranking for All
If you want to see the ranks of all the tested algorithms, run the following code statement −
lb.head(rows = lb.nrows)
Upon execution of the above statement, the following output will be generated (partially shown) −
Conclusion
H2O provides an easy-to-use open source platform for applying different ML algorithms on a given dataset. It provides several statistical and ML algorithms including deep learning. During testing, you can fine tune the parameters to these algorithms. You can do so using command-line or the provided web-based interface called Flow. H2O also supports AutoML that provides the ranking amongst the several algorithms based on their performance. H2O also performs well on Big Data. This is definitely a boon for Data Scientist to apply the different Machine Learning models on their dataset and pick up the best one to meet their needs.
