
Article Categories
- All Categories
-
 Data Structure
-
 Networking
-
 RDBMS
RDBMS
-
 Operating System
-
 Java
Java
-
 MS Excel
-
 iOS
iOS
-
 HTML
HTML
-
 CSS
CSS
-
 Android
-
 Python
-
 C Programming
-
 C++
C++
-
 C#
C#
-
 MongoDB
-
 MySQL
MySQL
-
 Javascript
-
 PHP
PHP
-
 Economics & Finance
Generate a DAX measure to compute the average BMI for hypertension patients
Introduction
In today's era, youngsters and older adults are suffering from hypertension and diabetes due to excessive work pressure. Manually calculating the average BMI in an enormous dataset is time-consuming for data analysts. To overcome this problem, the DAX measure is an excellent way to evaluate the average BMI of hypertension patients and count the number of diabetes patients. The complex problem would also be resolved swiftly, and accurate results would be generated through the DAX function.
We can follow these steps to create new measures in the Power BI desktop
Creation of a table in Microsoft Excel.
Load the table into the Power BI.
Generate a new measure.
Select the matrix table option from the Visualization section.
Acquire the result.
DAX measures to evaluate average BMI
Step 1
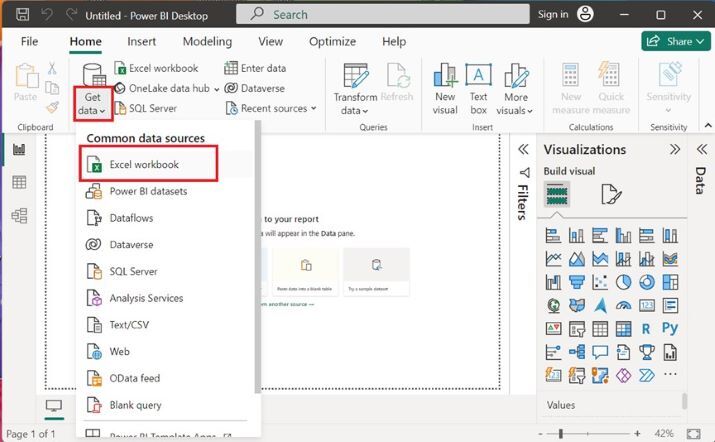
Users need to open the "Power BI Desktop" icon, switch to the "Home" tab select the "Get data" tile, and choose the "Excel workbook" option as shown below
Step 2
Select the file name ?hypertension.xlsx from the specified location of the system and then click on the "Open" button.

Step 3
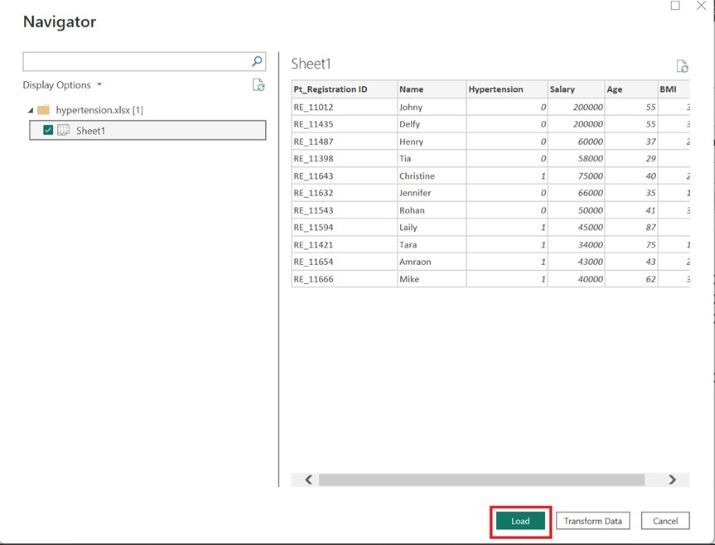
The preview of the Excel worksheet is shown in the Navigator window. You can click on the Sheet1 checkbox and then click on the "Load" button.
Step 4
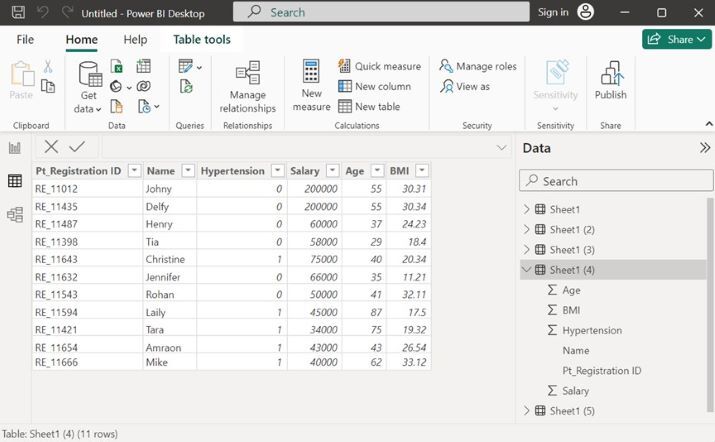
The Excel sheet "Sheet1(5)" is inserted into the Power BI desktop. The table comprises six columns named Pt_Registration ID, Name, Hypertension, Salary, Age, and BMI.
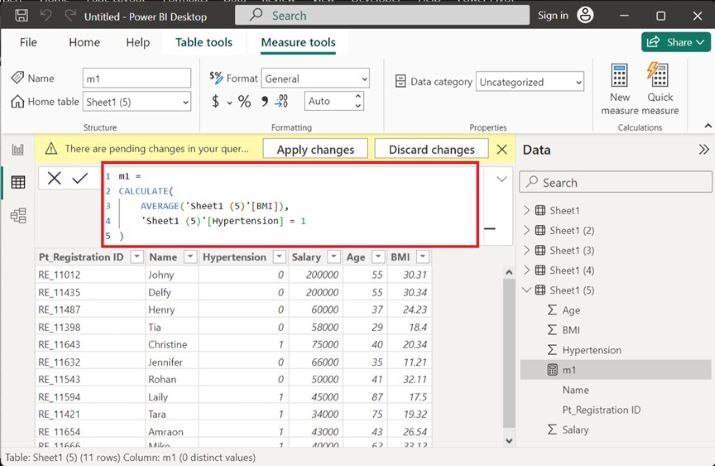
Step 5
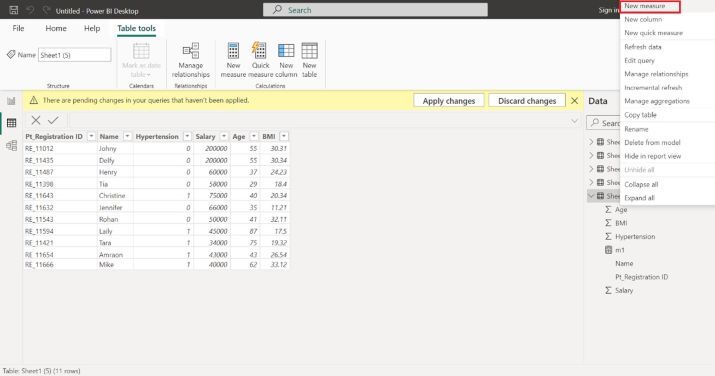
Users need to right-click on the Sheet1(5)? and choose the "New measure" option from the list. The name of the new measure is m1 which is used to calculate the average of the BMI of only hypertension patients. ?Sheet1(5)?[BMI] represents the BMI column of the Sheet1(5) table whereas ?Sheet1(5)?[Hypertension] denotes the Hypertension column of the Sheet1(5) table whose value is equal to 1. The patient is suffering from hypertension if its value in the hypertension column is 1.
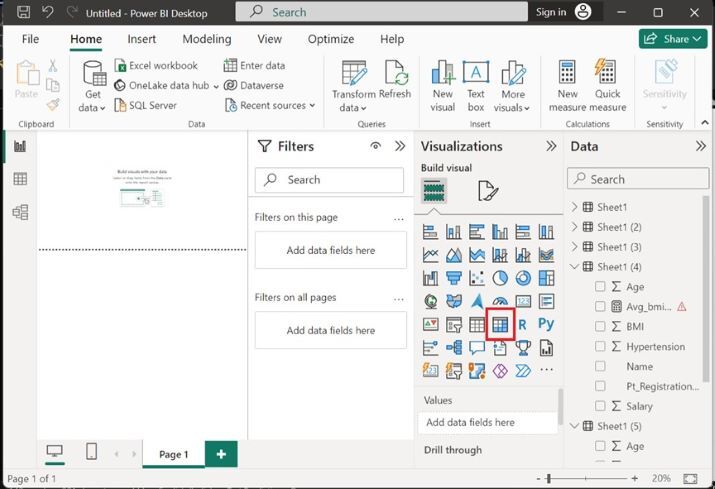
Step 6
To check the calculated result of the m1 measure, you can switch to the Report View, and select the matrix option from the Visualizations Section as given below
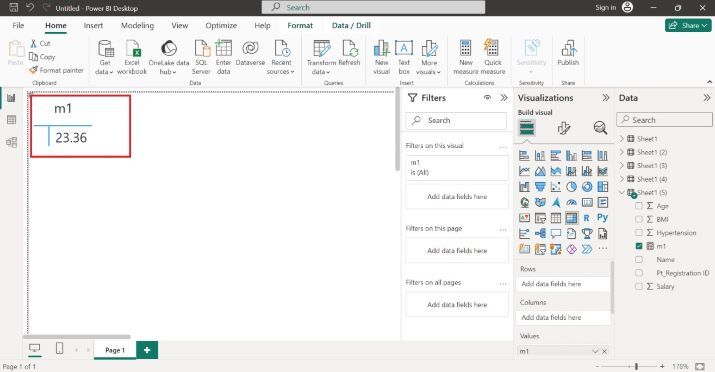
Step 7
Now, you can tick on the BMI checkbox from Sheet1(5). The average BMI is displayed on the window as illustrated below
Conclusion
By employing these crucial techniques showcased above, users may evaluate the average BMI for hypertension patients. The data analyst makes important decisions and reaches the outcome after generalizing these complicated expressions.

490 Views
