- Data Science - Home
- Data Science - Getting Started
- Data Science - What is Data?
- Data science - Lifecycle
- Data Science - Prerequisites
- Data Science - Applications
- Data Science - Machine Learning
- Data Science - Data Analysis
- Data Science - Tools in Demand
- Data Science - Careers
- Data Science - Scientists
- Data Scientist - Salary
- Data Science - Resources
- Data Science - Interview Questions
- Data Science Useful Resources
- Data Science - Quick Guide
- Data Science - Useful Resources
- Data Science - Discussion
Data Science - Quick Guide
Data Science - Getting Started
Data Science is the process of extracting and analysing useful information from data to solve problems that are difficult to solve analytically. For example, when you visit an e-commerce site and look at a few categories and products before making a purchase, you are creating data that Analysts can use to figure out how you make purchases.
It involves different disciplines like mathematical and statistical modelling, extracting data from its source and applying data visualization techniques. It also involves handling big data technologies to gather both structured and unstructured data.
It helps you find patterns that are hidden in the raw data. The term "Data Science" has evolved because mathematical statistics, data analysis, and "big data" have changed over time.
Data Science is an interdisciplinary field that lets you learn from both organised and unorganised data. With data science, you can turn a business problem into a research project and then apply into a real-world solution.
History of Data Science
John Tukey used the term "data analysis" in 1962 to define a field that resembled current modern data science. In a 1985 lecture to the Chinese Academy of Sciences in Beijing, C. F. Jeff Wu introduced the phrase "Data Science" as an alternative word for statistics for the first time. Subsequently, conference held at the University of Montpellier II in 1992 participants at a statistics recognised the birth of a new field centred on data of many sources and forms, integrating known ideas and principles of statistics and data analysis with computers.
Peter Naur suggested the phrase "Data Science" as an alternative name for computer science in 1974. The International Federation of Classification Societies was the first conference to highlight Data Science as a special subject in 1996. Yet, the concept remained in change. Following the 1985 lecture at the Chinese Academy of Sciences in Beijing, C. F. Jeff Wu again advocated for the renaming of statistics to Data Science in 1997. He reasoned that a new name would assist statistics in inaccurate stereotypes and perceptions, such as being associated with accounting or confined to data description. Hayashi Chikio proposed Data Science in 1998 as a new, multidisciplinary concept with three components: data design, data collecting, and data analysis.
In the 1990s, "knowledge discovery" and "data mining" were popular phrases for the process of identifying patterns in datasets that were growing in size.
In 2012, engineers Thomas H. Davenport and DJ Patil proclaimed "Data Scientist: The Hottest Job of the 21st Century," a term that was taken up by major metropolitan publications such as the New York Times and the Boston Globe. They repeated it a decade later, adding that "the position is in more demand than ever"
William S. Cleveland is frequently associated with the present understanding of Data Science as a separate field. In a 2001 study, he argued for the development of statistics into technological fields; a new name was required as this would fundamentally alter the subject. In the following years, "Data Science" grew increasingly prevalent. In 2002, the Council on Data for Science and Technology published Data Science Journal. Columbia University established The Journal of Data Science in 2003. The Section on Statistical Learning and Data Mining of the American Statistical Association changed its name to the Section on Statistical Learning and Data Science in 2014, reflecting the growing popularity of Data Science.
In 2008, DJ Patil and Jeff Hammerbacher were given the professional designation of "data scientist." Although it was used by the National Science Board in their 2005 study "Long-Lived Digital Data Collections: Supporting Research and Teaching in the 21st Century," it referred to any significant role in administering a digital data collection.
An agreement has not yet been reached on the meaning of Data Science, and some believe it to be a buzzword. Big data is a similar concept in marketing. Data scientists are responsible for transforming massive amounts of data into useful information and developing software and algorithms that assist businesses and organisations in determining optimum operations.
Why Data Science?
According to IDC, worldwide data will reach 175 zettabytes by 2025. Data Science helps businesses to comprehend vast amounts of data from different sources, extract useful insights, and make better data-driven choices. Data Science is used extensively in several industrial fields, such as marketing, healthcare, finance, banking, and policy work.
Here are significant advantages of using Data Analytics Technology −
Data is the oil of the modern age. With the proper tools, technologies, and algorithms, we can leverage data to create a unique competitive edge.
Data Science may assist in detecting fraud using sophisticated machine learning techniques.
It helps you avoid severe financial losses.
Enables the development of intelligent machines
You may use sentiment analysis to determine the brand loyalty of your customers. This helps you to make better and quicker choices.
It enables you to propose the appropriate product to the appropriate consumer in order to grow your company.
Need for Data Science
The data we have and how much data we generate
According to Forbes, the total quantity of data generated, copied, recorded, and consumed in the globe surged by about 5,000% between 2010 and 2020, from 1.2 trillion gigabytes to 59 trillion gigabytes.
How companies have benefited from Data Science?
Several businesses are undergoing data transformation (converting their IT architecture to one that supports Data Science), there are data boot camps around, etc. Indeed, there is a straightforward explanation for this: Data Science provides valuable insights.
Companies are being outcompeted by firms that make judgments based on data. For example, the Ford organization in 2006, had a loss of $12.6 billion. Following the defeat, they hired a senior data scientist to manage the data and undertook a three-year makeover. This ultimately resulted in the sale of almost 2,300,000 automobiles and earned a profit for 2009 as a whole.
Demand and Average Salary of a Data Scientist
According to India Today, India is the second biggest centre for Data Science in the world due to the fast digitalization of companies and services. By 2026, analysts anticipate that the nation will have more than 11 million employment opportunities. In fact, recruiting in the Data Science field has surged by 46% since 2019.
Bank of America was one of the first financial institutions to provide mobile banking to its consumers a decade ago. Recently, the Bank of America introduced Erica, its first virtual financial assistant. It is regarded the as best financial invention in the world.
Erica now serves as a client adviser for more than 45 million consumers worldwide. Erica uses Voice Recognition to receive client feedback, which represents a technical development in Data Science.
The Data Science and Machine Learning curves are steep. Although India sees a massive influx of data scientists each year, relatively few possess the needed skill set and specialization. As a consequence, people with specialised data skills are in great demand.
Impact of Data Science
Data Science has had a significant influence on several aspects of modern civilization. The significance of Data Science to organisations keeps on increasing. According to one research, the worldwide market for Data Science would reach $115 billion by 2023.
Healthcare industry has benefited from the rise of Data Science. In 2008, Google employees realised that they could monitor influenza strains in real time. Previous technologies could only provide weekly updates on instances. Google was able to build one of the first systems for monitoring the spread of diseases by using Data Science.
The sports sector has similarly profited from data science. A data scientist in 2019 found ways to measure and calculate how goal attempts increase a soccer team's odds of winning. In reality, data science is utilised to easily compute statistics in several sports.
Government agencies also use data science on a daily basis. Governments throughout the globe employ databases to monitor information regarding social security, taxes, and other data pertaining to their residents. The government's usage of emerging technologies continues to develop.
Since the Internet has become the primary medium of human communication, the popularity of e-commerce has also grown. With data science, online firms may monitor the whole of the customer experience, including marketing efforts, purchases, and consumer trends. Ads must be one of the greatest instances of eCommerce firms using data science. Have you ever looked for anything online or visited an eCommerce product website, only to be bombarded by advertisements for that product on social networking sites and blogs?
Ad pixels are integral to the online gathering and analysis of user information. Companies leverage online consumer behaviour to retarget prospective consumers throughout the internet. This usage of client information extends beyond eCommerce. Apps such as Tinder and Facebook use algorithms to assist users locate precisely what they are seeking. The Internet is a growing treasure trove of data, and the gathering and analysis of this data will also continue to expand.
Data Science - What is Data?
What is Data in Data Science?
Data is the foundation of data science. Data is the systematic record of a specified characters, quantity or symbols on which operations are performed by a computer, which may be stored and transmitted. It is a compilation of data to be utilised for a certain purpose, such as a survey or an analysis. When structured, data may be referred to as information. The data source (original data, secondary data) is also an essential consideration.
Data comes in many shapes and forms, but can generally be thought of as being the result of some random experiment - an experiment whose outcome cannot be determined in advance, but whose workings are still subject to analysis. Data from a random experiment are often stored in a table or spreadsheet. A statistical convention to denote variables is often called as features or columns and individual items (or units) as rows.
Types of Data
There are mainly two types of data, they are −
Qualitative Data
Qualitative data consists of information that cannot be counted, quantified, or expressed simply using numbers. It is gathered from text, audio, and pictures and distributed using data visualization tools, including word clouds, concept maps, graph databases, timelines, and infographics.
The objective of qualitative data analysis is to answer questions about the activities and motivations of individuals. Collecting, and analyzing this kind of data may be time-consuming. A researcher or analyst that works with qualitative data is referred to as a qualitative researcher or analyst.
Qualitative data can give essential statistics for any sector, user group, or product.
Types of Qualitative Data
There are mainly two types of Qualitative data, they are −
Nominal Data
In statistics, nominal data (also known as nominal scale) is used to designate variables without giving a numerical value. It is the most basic type of measuring scale. In contrast to ordinal data, nominal data cannot be ordered or quantified.
For example, The name of the person, the colour of the hair, nationality, etc. Lets assume a girl named Aby her hair is brown and she is from America.
Nominal data may be both qualitative and quantitative. Yet, there is no numerical value or link associated with the quantitative labels (e.g., identification number). In contrast, several qualitative data categories can be expressed in nominal form. These might consist of words, letters, and symbols. Names of individuals, gender, and nationality are some of the most prevalent instances of nominal data.
Analyze Nominal Data
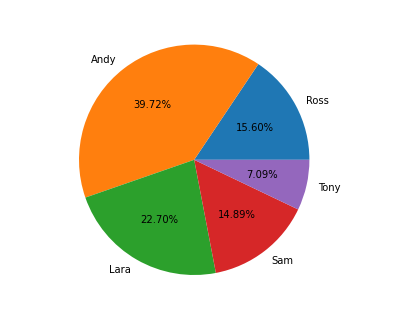
Using the grouping approach, nominal data can be analyzed. The variables may be sorted into groups, and the frequency or percentage can be determined for each category. The data may also be shown graphically, for example using a pie chart.
Although though nominal data cannot be processed using mathematical operators, they may still be studied using statistical techniques. Hypothesis testing is one approach to assess and analyse the data.
With nominal data, nonparametric tests such as the chi-squared test may be used to test hypotheses. The purpose of the chi-squared test is to evaluate whether there is a statistically significant discrepancy between the predicted frequency and the actual frequency of the provided values.
Ordinal Data
Ordinal data is a type of data in statistics where the values are in a natural order. One of the most important things about ordinal data is that you can't tell what the differences between the data values are. Most of the time, the width of the data categories doesn't match the increments of the underlying attribute.
In some cases, the characteristics of interval or ratio data can be found by grouping the values of the data. For instance, the ranges of income are ordinal data, while the actual income is ratio data.
Ordinal data can't be changed with mathematical operators like interval or ratio data can. Because of this, the median is the only way to figure out where the middle of a set of ordinal data is.
This data type is widely found in the fields of finance and economics. Consider an economic study that examines the GDP levels of various nations. If the report rates the nations based on their GDP, the rankings are ordinal statistics.
Analyzing Ordinal Data
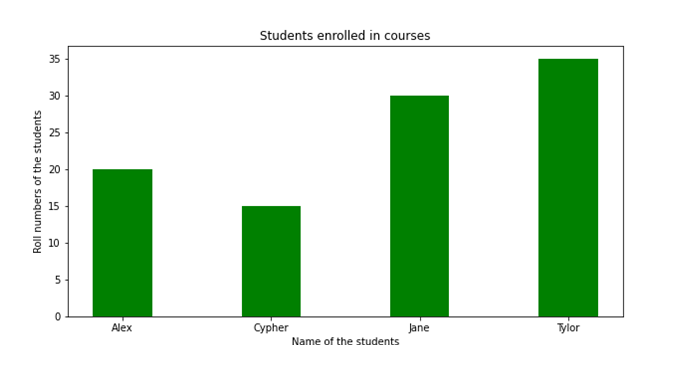
Using visualisation tools to evaluate ordinal data is the easiest method. For example, the data may be displayed as a table where each row represents a separate category. In addition, they may be represented graphically using different charts. The bar chart is the most popular style of graph used to display these types of data.
Ordinal data may also be studied using sophisticated statistical analysis methods like hypothesis testing. Note that parametric procedures such as the t-test and ANOVA cannot be used to these data sets. Only nonparametric tests, such as the Mann-Whitney U test or Wilcoxon Matched-Pairs test, may be used to evaluate the null hypothesis about the data.
Qualitative Data Collection Methods
Below are some approaches and collection methods to collect qualitative data −
Data Records − Utilizing data that is already existing as the data source is a best technique to do qualitative research. Similar to visiting a library, you may examine books and other reference materials to obtain data that can be utilised for research.
Interviews − Personal interviews are one of the most common ways to get deductive data for qualitative research. The interview may be casual and not have a set plan. It is often like a conversation. The interviewer or researcher gets the information straight from the interviewee.
Focus Groups − Focus groups are made up of 6 to 10 people who talk to each other. The moderator's job is to keep an eye on the conversation and direct it based on the focus questions.
Case Studies − Case studies are in-depth analyses of an individual or group, with an emphasis on the relationship between developmental characteristics and the environment.
Observation − It is a technique where the researcher observes the object and take down transcript notes to find out innate responses and reactions without prompting.
Quantitative Data
Quantitative data consists of numerical values, has numerical features, and mathematical operations can be performed on this type of data such as addition. Quantitative data is mathematically verifiable and evaluable due to its quantitative character.
The simplicity of their mathematical derivations makes it possible to govern the measurement of different parameters. Typically, it is gathered for statistical analysis through surveys, polls, or questionnaires given to a subset of a population. Researchers are able to apply the collected findings to an entire population.
Types of Quantitative Data
There are mainly two types of quantitative data, they are −
Discrete Data
These are data that can only take on certain values, as opposed to a range. For instance, data about the blood type or gender of a population is considered discrete data.
Example of discrete quantitative data may be the number of visitors to your website; you could have 150 visits in one day, but not 150.6 visits. Usually, tally charts, bar charts, and pie charts are used to represent discrete data.
Characteristics of Discrete Data
Since it is simple to summarise and calculate discrete data, it is often utilized in elementary statistical analysis. Let's examine some other essential characteristics of discrete data −
Discrete data is made up of discrete variables that are finite, measurable, countable, and can't be negative (5, 10, 15, and so on).
Simple statistical methods, like bar charts, line charts, and pie charts, make it easy to show and explain discrete data.
Data can also be categorical, which means it has a fixed number of data values, like a person's gender.
Data that is both time- and space-bound is spread out in a random way. Discrete distributions make it easier to look at discrete values.
Continuous Data
These are data that may take values between a certain range, including the greatest and lowest possible. The difference between the greatest and least value is known as the data range. For instance, the height and weight of your school's children. This is considered continuous data. The tabular representation of continuous data is known as a frequency distribution. These may be depicted visually using histograms.
Characteristics of continuous data
Continuous data, on the other hand, can be either numbers or spread out over time and date. This data type uses advanced statistical analysis methods because there are an infinite number of possible values. The important characteristics about continuous data are −
Continuous data changes over time, and at different points in time, it can have different values.
Random variables, which may or may not be whole numbers, make up continuous data.
Data analysis tools like line graphs, skews, and so on are used to measure continuous data.
One type of continuous data analysis that is often used is regression analysis.
Quantitative Data Collection Methods
Below are some approaches and collection methods to collect quantitative data −
Surveys and Questionnaires − These types of research are good for getting detailed feedback from users and customers, especially about how people feel about a product, service, or experience.
Open-source Datasets − There are a lot of public datasets that can be found online and analysed for free. Researchers sometimes look at data that has already been collected and try to figure out what it means in a way that fits their own research project.
Experiments − A common method is an experiment, which usually has a control group and an experimental group. The experiment is set up so that it can be controlled and the conditions can be changed as needed.
Sampling − When there are a lot of data points, it may not be possible to survey each person or data point. In this case, quantitative research is done with the help of sampling. Sampling is the process of choosing a sample of data that is representative of the whole. The two types of sampling are Random sampling (also called probability sampling), and non-random sampling.
Types of Data Collection
Data collection can be classified into two types according to the source −
Primary Data − These are the data that are acquired for the first time for a particular purpose by an investigator. Primary data are 'pure' in the sense that they have not been subjected to any statistical manipulations and are authentic. Examples of primary data include the Census of India.
Secondary Data − These are the data that were initially gathered by a certain entity. This indicates that this kind of data has already been gathered by researchers or investigators and is accessible in either published or unpublished form. This data is impure because statistical computations may have previously been performed on it. For example, Information accessible on the website of the Government of India or the Department of Finance, or in other archives, books, journals, etc.
Big Data
Big data is defined as data with a larger volume and require overcoming logistical challenges to deal with them. Big data refers to bigger, more complicated data collections, particularly from novel data sources. Some data sets are so extensive that conventional data processing software is incapable of handling them. But, these vast quantities of data can be use to solve business challenges that were previously unsolvable.
Data Science is the study of how to analyse huge amount of data and get the information from them. You can compare big data and data science to crude oil and an oil refinery. Data Science and big data grew out of statistics and traditional ways of managing data, but they are now seen as separate fields.
People often use the three Vs to describe the characteristics of big data −
Volume − How much information is there?
Variety − How different are the different kinds of data?
Velocity − How fast do new pieces of information get made?
How do we use Data in Data Science?
Every data must undergo pre-processing. This is an essential series of processes that converts raw data into a more comprehensible and valuable format for further processing. Common procedures are −
Collect and Store the Dataset
Data Cleaning
Handling Missing data
Noisy Data
Data Integration
Data Transformation
Generalization
Normalization
Attribute Selection
Aggregation
We will discuss these processes in detail in upcoming chapters.
Data Science - Lifecycle
What is Data Science Lifecycle?
A data science lifecycle is a systematic approach to find a solution for a data problem which shows the steps that are taken to develop, deliver/deploy , and maintain a data science project. We can assume a general data science lifecycle with some of the most important common steps that is shown in the figure given below but some steps may differ from project to project as each project is different so life cycle may differ since not every data science project is built the same way
A standard data science lifecycle approach comprises the use of machine learning algorithms and statistical procedures that result in more accurate prediction models. Data extraction, preparation, cleaning, modelling, assessment, etc., are some of the most important data science stages. This technique is known as "Cross Industry Standard Procedure for Data Mining" in the field of data science.
How many phases are there in the Data Science Life Cycle?
There are mainly six phases in Data Science Life Cycle −
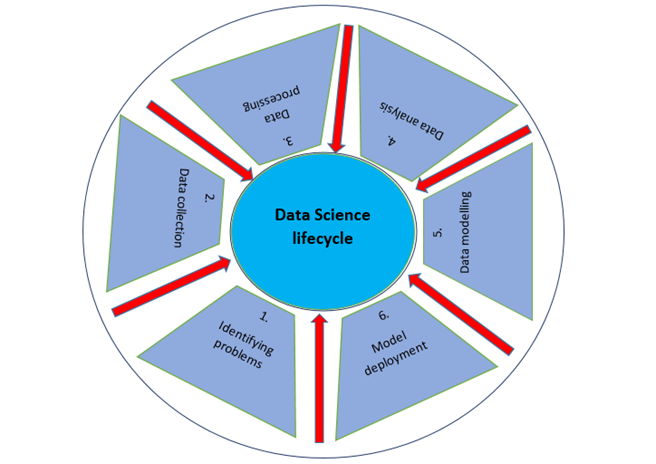
Identifying Problem and Understanding the Business
The data science lifecycle starts with "why?" just like any other business lifecycle. One of the most important parts of the data science process is figuring out what the problem is. This helps to find a clear goal around which all the other steps can be planned out. In short, it's important to know the business goal as earliest because it will determine what the end goal of the analysis will be.
This phase should evaluate the trends of business, assess case studies of comparable analyses, and research the industrys domain. The group will evaluate the feasibility of the project given the available employees, equipment, time, and technology. When these factors been discovered and assessed, a preliminary hypothesis will be formulated to address the business issues resulting from the existing environment. This phrase should −
Specify the issue that why the problem must be resolved immediately and demands answer.
Specify the business project's potential value.
Identify dangers, including ethical concerns, associated with the project.
Create and convey a flexible, highly integrated project plan.
Data Collection
The next step in the data science lifecycle is data collection, which means getting raw data from the appropriate and reliable source. The data that is collected can be either organized or unorganized. The data could be collected from website logs, social media data, online data repositories, and even data that is streamed from online sources using APIs, web scraping, or data that could be in Excel or any other source.
The person doing the job should know the difference between the different data sets that are available and how an organization invests its data. Professionals find it hard to keep track of where each piece of data comes from and whether it is up to date or not. During the whole lifecycle of a data science project, it is important to keep track of this information because it could help test hypotheses or run any other new experiments.
The information may be gathered by surveys or the more prevalent method of automated data gathering, such as internet cookies which is the primary source of data that is unanalysed.
We can also use secondary data which is an open-source dataset. There are many available websites from where we can collect data for example
Kaggle (https://www.kaggle.com/datasets),
Google Public Datasets (https://cloud.google.com/bigquery/public-data/)
There are some predefined datasets available in python. Lets import the Iris dataset from python and use it to define phases of data science.
from sklearn.datasets import load_iris
import pandas as pd

# Load Data
iris = load_iris()

# Create a dataframe
df = pd.DataFrame(iris.data, columns = iris.feature_names)
df['target'] = iris.target
X = iris.data
Data Processing
After collecting high-quality data from reliable sources, next step is to process it. The purpose of data processing is to ensure if there is any problem with the acquired data so that it can be resolved before proceeding to the next phase. Without this step, we may produce mistakes or inaccurate findings.
There may be several difficulties with the obtained data. For instance, the data may have several missing values in multiple rows or columns. It may include several outliers, inaccurate numbers, timestamps with varying time zones, etc. The data may potentially have problems with date ranges. In certain nations, the date is formatted as DD/MM/YYYY, and in others, it is written as MM/DD/YYYY. During the data collecting process numerous problems can occur, for instance, if data is gathered from many thermometers and any of them are defective, the data may need to be discarded or recollected.
At this phase, various concerns with the data must be resolved. Several of these problems have multiple solutions, for example, if the data includes missing values, we can either replace them with zero or the column's mean value. However, if the column is missing a large number of values, it may be preferable to remove the column completely since it has so little data that it cannot be used in our data science life cycle method to solve the issue.
When the time zones are all mixed up, we cannot utilize the data in those columns and may have to remove them until we can define the time zones used in the supplied timestamps. If we know the time zones in which each timestamp was gathered, we may convert all timestamp data to a certain time zone. In this manner, there are a number of strategies to address concerns that may exist in the obtained data.
We will access the data and then store it in a dataframe using python.
from sklearn.datasets import load_iris
import pandas as pd
import numpy as np

# Load Data
iris = load_iris()

# Create a dataframe
df = pd.DataFrame(iris.data, columns = iris.feature_names)
df['target'] = iris.target
X = iris.data
All data must be in numeric representation for machine learning models. This implies that if a dataset includes categorical data, it must be converted to numeric values before the model can be executed. So we will be implementing label encoding.
Label Encoding
species = []
for i in range(len(df['target'])):
   if df['target'][i] == 0:
      species.append("setosa")
   elif df['target'][i] == 1:
      species.append('versicolor')
   else:
      species.append('virginica')
df['species'] = species
labels = np.asarray(df.species)
df.sample(10)
labels = np.asarray(df.species)
from sklearn.preprocessing import LabelEncoder
le = LabelEncoder()
le.fit(labels)
labels = le.transform(labels)
df_selected1 = df.drop(['sepal length (cm)', 'sepal width (cm)', "species"], axis=1)
Data Analysis
Data analysis Exploratory Data Analysis (EDA) is a set of visual techniques for analysing data. With this method, we may get specific details on the statistical summary of the data. Also, we will be able to deal with duplicate numbers, outliers, and identify trends or patterns within the collection.
At this phase, we attempt to get a better understanding of the acquired and processed data. We apply statistical and analytical techniques to make conclusions about the data and determine the link between several columns in our dataset. Using pictures, graphs, charts, plots, etc., we may use visualisations to better comprehend and describe the data.
Professionals use data statistical techniques such as the mean and median to better comprehend the data. Using histograms, spectrum analysis, and population distribution, they also visualise data and evaluate its distribution patterns. The data will be analysed based on the problems.
Example
Below code is used to check if there are any null values in the dataset −
df.isnull().sum()
Output
sepal length (cm) 0
sepal width (cm) 0
petal length (cm) 0
petal width (cm) 0
target 0
species 0
dtype: int64
From the above output we can conclude that there are no null values in the dataset as the sum of all the null values in the column is 0.
We will be using shape parameter to check the shape (rows, columns) of the dataset −
Example
df.shape
Output
(150, 5)
Now we will use info() to check the columns and their data types −
Example
df.info()
Output
<class 'pandas.core.frame.DataFrame'>
RangeIndex: 150 entries, 0 to 149
Data columns (total 5 columns):
 #   Column             Non-Null Count  Dtype
---  ------             --------------  -----
 0   sepal length (cm)  150 non-null    float64
 1   sepal width (cm)   150 non-null    float64
 2   petal length (cm)  150 non-null    float64
 3   petal width (cm)   150 non-null    float64
 4   target             150 non-null    int64
dtypes: float64(4), int64(1)
memory usage: 6.0 KB
Only one column contains category data, whereas the other columns include non-Null numeric values.
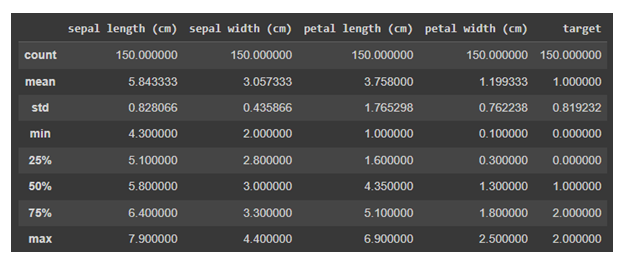
Now we will use describe() on the data. The describe() method performs fundamental statistical calculations to a dataset, such as extreme values, the number of data points, standard deviation, etc. Any missing or NaN values are immediately disregarded. The describe() method accurately depicts the distribution of data.
Example
df.describe()
Output
Data Visualization
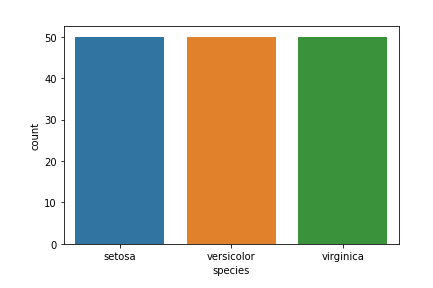
Target column − Our target column will be the Species column since we will only want results based on species in the end.
Matplotlib and seaborn library will be used for data visualization.
Below is the species countplot −
Example
import seaborn as sns
import matplotlib.pyplot as plt

sns.countplot(x='species', data=df, )
plt.show()
Output
There are many other visualization plots in Data Science. To know more about them refer https://www.tutorialspoint.com/machine_learning_with_python
Data Modeling
Data Modeling is one of the most important aspects of data science and is sometimes referred to as the core of data analysis. The intended output of a model should be derived from prepared and analysed data. The environment required to execute the data model will be chosen and constructed, before achieving the specified criteria.
At this phase, we develop datasets for training and testing the model for production-related tasks. It also involves selecting the correct mode type and determining if the problem involves classification, regression, or clustering. After analysing the model type, we must choose the appropriate implementation algorithms. It must be performed with care, as it is crucial to extract the relevant insights from the provided data.
Here machine learning comes in picture. Machine learning is basically divided into classification, regression, or clustering models and each model have some algorithms which is applied on the dataset to get the relevant information. These models are used in this phase. We will discuss these models in detail in the machine learning chapter.
Model Deployment
We have reached the final stage of the data science lifecycle. The model is finally ready to be deployed in the desired format and chosen channel after a detailed review process. Note that the machine learning model has no utility unless it is deployed in the production. Generally speaking, these models are associated and integrated with products and applications.
Model Deployment contains the establishment of a delivery method necessary to deploy the model to market consumers or to another system. Machine learning models are also being implemented on devices and gaining acceptance and appeal. Depending on the complexity of the project, this stage might range from a basic model output on a Tableau Dashboard to a complicated cloud-based deployment with millions of users.
Who are all involved in Data Science lifecycle?
Data is being generated, collected, and stored on voluminous servers and data warehouses from the individual level to the organisational level. But how will you access this massive data repository? This is where the data scientist comes in, since he or she is a specialist in extracting insights and patterns from unstructured text and statistics.
Below, we present the many job profiles of the data science team participating in the data science lifecycle.
| S.No | Job Profile & Role |
|---|---|
| 1 | Business Analyst
Understanding business requirements and find the right target customers. |
| 2 | Data Analyst
Format and clean the raw data, interpret and visualise them to perform the analysis and provide the technical summary of the same |
| 3 | Data Scientists
Improve quality of machine learning models. |
| 4 | Data Engineer
They are in charge of gathering data from social networks, websites, blogs, and other internal and external web sources ready for further analysis. |
| 5 | Data Architect
Connect, centralise, protect, and keep up with the organization's data sources. |
| 6 | Machine Learning Engineer
Design and implement machine learning-related algorithms and applications. |
Data Science - Prerequisites
You need to have several technical and non-technical skills to become a successful Data Scientist. Some of the skills are essential to have to become a well-versed data scientist while some for just for making thing things easier for a data scientist. Different job roles determine the level of skill-specific proficiency you need to possess.
Given below are some skills you will require to become a data scientist.
Technical Skills
Python
Data Scientists use Python a lot because it is one of the most popular programming languages, easy to learn and has extensive libraries that can be used for data manipulation and data analysis. Since it is a flexible language, it can be used in all stages of Data Science, such as data mining or running applications. Python has a huge open-source library with powerful Data Science libraries like Numpy, Pandas, Matplotlib, PyTorch, Keras, Scikit Learn, Seaborn, etc. These libraries help with different Data Science tasks, such as reading large datasets, plotting and visualizing data and correlations, training and fitting machine learning models to your data, evaluating the performance of the model, etc.
SQL
SQL is an additional essential prerequisite before getting started with Data Science. SQL is relatively simple compared to other programming languages, but is required to become a Data Scientist. This programming language is used to manage and query relational database-stored data. We can retrieve, insert, update, and remove data with SQL. To extract insights from data, it is crucial to be able to create complicated SQL queries that include joins, group by, having, etc. The join method enables you to query many tables simultaneously. SQL also enables the execution of analytical operations and the transformation of database structures.
R
R is an advanced language that is used to make complex models of statistics. R also lets you work with arrays, matrices, and vectors. R is well-known for its graphical libraries, which let users draw beautiful graphs and make them easy to understand.
With R Shiny, programmers can make web applications using R, which is used to embed visualizations in web pages and gives users a lot of ways to interact with them. Also, data extraction is a key part of the science of data. R lets you connect your R code to database management systems.
R also gives you a number of options for more advanced data analysis, such as building prediction models, machine learning algorithms, etc. R also has a number of packages for processing images.
Statistics
In data science, advanced machine learning algorithms that stores and translate data patterns for prediction rely heavily on statistics. Data scientists utilize statistics to collect, assess, analyze, and derive conclusions from data, as well as to apply relevant quantitative mathematical models and variables. Data scientists work as programmers, researchers, and executives in business, among other roles, all of these disciplines have a statistical foundation. The importance of statistics in data science is comparable to that of programming languages.
Hadoop
Data scientists perform operations on enormous amount of data but sometimes the memory of the system is not able to carry out processing on these huge amount of data. So how data processing will be performed on such huge amount of data? Here Hadoop comes in the picture. It is used to rapidly divide and transfer data to numerous servers for data processing and other actions such as filtering. While Hadoop is based on the concept of Distributed Computing, several firms require that Data Scientists have a fundamental understanding of Distributed System principles such as Pig, Hive, MapReduce, etc. Several firms have begun to use Hadoop-as-a-Service (HaaS), another name for Hadoop in the cloud, so that Data Scientists do not need to understand Hadoop's inner workings.
Spark
Spark is a framework for big data computation like Hadoop and has gained some popularity in Data Science world. Hadoop reads data from the disk and writes data to the disk while on the other hand Spark Calculates the computation results in the system memory, making it comparatively easy and faster than Hadoop. The function of Apache Spark is to facilitate the speed of the complex algorithms and it is specially designed for the data science. If the dataset is huge then it distributes data processing which saves a lot of time. The main reason of using apache spark is because of its speed and the platform it provides to run data science tasks and processes. It is possible to run Spark on a single machine or a cluster of machines which makes it convenient to work with.
Machine Learning
Machine Learning is crucial component of Data Science. Machine Learning algorithms are an effective method for analysing massive volumes of data. It may assist in automating a variety of Data Science-related operations. Nevertheless, an in-depth understanding of Machine Learning principles is not required to begin a career in this industry. The majority of Data Scientists lack skills in Machine Learning. Just a tiny fraction of Data Scientists has extensive knowledge and expertise in advanced topics such as Recommendation Engines, Adversarial Learning, Reinforcement Learning, Natural Language Processing, Outlier Detection, Time Series Analysis, Computer Vision, Survival Analysis, etc. These competencies will consequently help you stand out in a Data Science profession.
Non-Technical Skills
Understanding of Business Domain
More understanding one has for a particular business area or domain, easier it will be for a data scientist to do the analysis on the data from that particular domain.
Understanding of Data
Data Science is all about data so it is very important to have an understanding of data that what is data, how data is stored, knowledge of tables, rows and columns.
Critical and Logical Thinking
Critical thinking is the ability to think clearly and logically while figuring out and understanding how ideas fit together. In data science, you need to be able to think critically to get useful insights and improve business operations. Critical thinking is probably one of the most important skills in data science. It makes it easier for them to dig deeper into information and find the most important things.
Product Understanding
Designing models isn't the entire job of a data scientist. Data scientists have to come up with insights that can be used to improve the quality of products. With a systematic approach, professionals can accelerate quickly if they understand the whole product. They can help models get started (bootstrap) and improve feature engineering. This skill also helps them improve their storytelling by revealing thoughts and insights about products that they may not have thought of before.
Adaptability
One of the most sought-after soft skills for data scientists in the modern talent acquisition process is the ability to adapt. Because new technologies are being made and used more quickly, professionals have to quickly learn how to use them. As a data scientist, you have to keep up with changing business trends and be able to adapt.
Data Science - Applications
Data Science involves different disciplines like mathematical and statistical modelling, extracting data from its source and applying data visualization techniques. It also involves handling big data technologies to gather both structured and unstructured data. Below, we will see some applications of data science −
Gaming Industry
By establishing a presence on social media, sports organizations deal with a number of issues. Zynga, a gaming corporation, has produced social media games like Zynga Poker, Farmville, Chess with Friends, Speed Guess Something, and Words with Friends. This has generated many user connections and large data volumes.
Here comes the necessity for data science within the game business in order to use the data acquired from players across all social networks. Data analysis provides a captivating, innovative diversion for players to keep ahead of the competition! One of the most interesting applications of data science is inside the features and procedures of game creation.
Health Care
Data Science plays an important role in the field of healthcare. A Data Scientist's responsibility is to integrate all Data Science methodologies into healthcare software. The Data Scientist helps in collecting useful insights from the data in order to create prediction models. The overall responsibilities of a Data Scientist in the field of healthcare are as follows −
Collecting information from patients
Analyzing hospitals' requirements
Organizing and classifying the data for usage
Implementing Data Analytics with diverse methods
Using algorithms to extract insights from data.
Developing predictive models with the development staff.
Given below are some of the applications of data science −
Medical Image Analysis
Data Science helps to determine the abnormalities in a human body by performing image analysis on scanned images, hence assisting physicians in developing an appropriate treatment plan. These picture examinations include X-ray, sonography, MRI (Magnetic Resonance Imaging), and CT scan, among others. Doctors are able to give patients with better care by gaining vital information from the study of these test photos.
Predictive Analysis
The condition of a patient is predicted by the predictive analytics model developed using Data Science. In addition, it facilitates the development of strategies for the patient's suitable treatment. Predictive analytics is a highly important tool of data science that plays a significant part in the healthcare business.
Image Recognition
Image recognition is a technique of image processing that identifies everything in an image, including individuals, patterns, logos, items, locations, colors, and forms.
Data Science techniques have begun to recognize the human face and match it with all the images in their database. In addition, mobile phones with cameras are generating infinite number of digital images and videos. This vast amount of digital data is being utilized by businesses to provide customers with superior and more convenient services. Generally, the facial recognition system of AI analyses all facial characteristics and compares them to its database to find a match.
For example, Facial detection in Face lock feature in iPhone.
Recommendation systems
As online shopping becomes more prevalent, the e-commerce platforms are able to capture users shopping preferences as well as the performance of various products in the market. This leads to creation of recommendation systems, which create models predicting the shoppers needs and show the products the shopper is most likely to buy. Companies like Amazon and Netflix use recommendation system so that they can help their user to find the correct movie or product they are looking for.
Airline Routing Planning
Data Science in the Airline Industry presents numerous opportunities. High-flying aircraft provide an enormous amount of data about engine systems, fuel efficiency, weather, passenger information, etc. More data will be created when more modern aircraft equipped with sensors and other data collection technologies are used by the industry. If appropriately used, this data may provide new possibilities for the sector.
It also helps to decide whether to directly land at the destination or take a halt in between like a flight can have a direct route.
Finance
The importance and relevance of data science in the banking sector is comparable to that of data science in other areas of corporate decision-making. Professionals in data science for finance give support and assistance to relevant teams within the company, particularly the investment and financial team, by assisting them in the development of tools and dashboards to enhance the investment process.
Improvement in Health Care services
The health care industry deals with a variety of data which can be classified into technical data, financial data, patient information, drug information and legal rules. All this data need to be analyzed in a coordinated manner to produce insights that will save cost, both for the health care provider and care receiver, while remaining legally compliant.
Computer Vision
The advancement in recognizing an image by a computer involves processing large sets of image data from multiple objects of same category. For example, Face recognition. These data sets are modelled, and algorithms are created to apply the model to newer images (testing dataset) to get a satisfactory result. Processing of these huge data sets and creation of models need various tools used in Data Science.
Efficient Management of Energy
As the demand for energy consumption rises, the energy producing companies need to manage the various phases of the energy production and distribution more efficiently. This involves optimizing the production methods, the storage and distribution mechanisms as well as studying the customers consumption patterns. Linking the data from all these sources and deriving insight seems a daunting task. This is made easier by using the tools of data science.
Internet Search
Several search engines use data science to understand user behaviour and search patterns. These search engines use diverse data science approaches to give each user with the most relevant search results. Search engines such as Google, Yahoo, Bing, etc. are becoming increasingly competent at replying to searches in seconds as time passes.
Speech Recognition
Google's Voice Assistant, Apple's Siri, and Microsoft's Cortana all utilise large datasets and are powered by data science and natural language processing (NLP) algorithms. Speech recognition software improves and gains a deeper understanding of human nature due to the application of data science as more data is analysed.
Education
While the world experienced the COVID-19 epidemic, the majority of students were always carrying their computers. Online Courses, E-Submissions of assignments and examinations, etc., have been used by the Indian education system. For the majority of us, doing everything "online" remains challenging. Technology and contemporary times have undergone a metamorphosis. As a result, Data Science in education is more crucial than ever as it enters our educational system.
Now, instructors and students' everyday interactions are being recorded through a variety of platforms, and class participation and other factors are being evaluated. As a result, the rising quantity of online courses has increased the value of Educational data's depth.
Data Science - Machine Learning
Machine learning enables a machine to automatically learn from data, improve performance from experiences, and predict things without being explicitly programmed. Machine Learning is mainly concerned with the development of algorithms which allow a computer to learn from the data and past experiences on their own. The term machine learning was first introduced by Arthur Samuel in 1959.
Data Science is the science of gaining useful insights from data in order to get the most crucial and relevant information source. And given a dependable stream of data, generating predictions using machine learning.
Data Science and machine learning are subfields of computer science that focus on analyzing and making use of large amounts of data to improve the processes by which products, services, infrastructural systems, and more are developed and introduced to the market.
The two relate to each other in a similar manner that squares are rectangles, but rectangles are not squares. Data Science is the all-encompassing rectangle, while machine learning is a square that is its own entity. They are both commonly employed by data scientists in their job and are increasingly being accepted by practically every business.
What is Machine Learning?
Machine learning (ML) is a type of algorithm that lets software get more accurate at predicting what will happen in future without being specifically programmed to do so. The basic idea behind machine learning is to make algorithms that can take data as input and use statistical analysis to predict an output while also updating outputs as new data becomes available.
Machine learning is a part of artificial intelligence that uses algorithms to find patterns in data and then predict how those patterns will change in the future. This lets engineers use statistical analysis to look for patterns in the data.
Facebook, Twitter, Instagram, YouTube, and TikTok collect information about their users, based on what you've done in the past, it can guess your interests and requirements and suggest products, services, or articles that fit your needs.
Machine learning is a set of tools and concepts that are used in data science, but they also show up in other fields. Data scientists often use machine learning in their work to help them get more information faster or figure out trends.
Types of Machine Learning
Machine learning can be classified into three types of algorithms −
Supervised learning
Unsupervised learning
Reinforcement learning
Supervised Learning
Supervised learning is a type of machine learning and artificial intelligence. It is also called "supervised machine learning." It is defined by the fact that it uses labelled datasets to train algorithms how to correctly classify data or predict outcomes. As data is put into the model, its weights are changed until the model fits correctly. This is part of the cross validation process. Supervised learning helps organisations find large-scale solutions to a wide range of real-world problems, like classifying spam in a separate folder from your inbox like in Gmail we have a spam folder.
Supervised Learning Algorithms
Some supervised learning algorithms are −
Naive Bayes − Naive Bayes is a classification algoritm that is based on the Bayes Theorem's principle of class conditional independence. This means that the presence of one feature doesn't change the likelihood of another feature, and that each predictor has the same effect on the result/outcome.
Linear Regression − Linear regression is used to find how a dependent variable is related to one or more independent variables and to make predictions about what will happen in the future. Simple linear regression is when there is only one independent variable and one dependent variable.
Logistic Regression − When the dependent variables are continuous, linear regression is used. When the dependent variables are categorical, like "true" or "false" or "yes" or "no," logistic regression is used. Both linear and logistic regression seek to figure out the relationships between the data inputs. However, logistic regression is mostly used to solve binary classification problems, like figuring out if a particular mail is a spam or not.
Support Vector Machines(SVM) − A support vector machine is a popular model for supervised learning developed by Vladimir Vapnik. It can be used to both classify and predict data. So, it is usually used to solve classification problems by making a hyperplane where the distance between two groups of data points is the greatest. This line is called the "decision boundary" because it divides the groups of data points (for example, oranges and apples) on either side of the plane.
K-nearest Neighbour − The KNN algorithm, which is also called the "k-nearest neighbour" algorithm, groups data points based on how close they are to and related to other data points. This algorithm works on the idea that data points that are similar can be found close to each other. So, it tries to figure out how far apart the data points are, using Euclidean distance and then assigns a category based on the most common or average category. However, as the size of the test dataset grows, the processing time increases, making it less useful for classification tasks.
Random Forest − Random forest is another supervised machine learning algorithm that is flexible and can be used for both classification and regression. The "forest" is a group of decision trees that are not correlated to each other. These trees are then combined to reduce variation and make more accurate data predictions.
Unsupervised Learning
Unsupervised learning, also called unsupervised machine learning, uses machine learning algorithms to look at unlabelled datasets and group them together. These programmes find hidden patterns or groups of data. Its ability to find similarities and differences in information makes it perfect for exploratory data analysis, cross-selling strategies, customer segmentation, and image recognition.
Common Unsupervised Learning Approaches
Unsupervised learning models are used for three main tasks: clustering, making connections, and reducing the number of dimensions. Below, we'll describe learning methods and common algorithms used −
Clustering − Clustering is a method for data mining that organises unlabelled data based on their similarities or differences. Clustering techniques are used to organise unclassified, unprocessed data items into groups according to structures or patterns in the data. There are many types of clustering algorithms, including exclusive, overlapping, hierarchical, and probabilistic.
K-means Clustering is a popular example of an clustering approach in which data points are allocated to K groups based on their distance from each group's centroid. The data points closest to a certain centroid will be grouped into the same category. A higher K number indicates smaller groups with more granularity, while a lower K value indicates bigger groupings with less granularity. Common applications of K-means clustering include market segmentation, document clustering, picture segmentation, and image compression.
Dimensionality Reduction − Although more data typically produces more accurate findings, it may also affect the effectiveness of machine learning algorithms (e.g., overfitting) and make it difficult to visualize datasets. Dimensionality reduction is a strategy used when a dataset has an excessive number of characteristics or dimensions. It decreases the quantity of data inputs to a manageable level while retaining the integrity of the dataset to the greatest extent feasible. Dimensionality reduction is often employed in the data pre-processing phase, and there are a number of approaches, one of them is −
Principal Component Analysis (PCA) − It is a dimensionality reduction approach used to remove redundancy and compress datasets through feature extraction. This approach employs a linear transformation to generate a new data representation, resulting in a collection of "principal components." The first principal component is the dataset direction that maximises variance. Although the second principal component similarly finds the largest variance in the data, it is fully uncorrelated with the first, resulting in a direction that is orthogonal to the first. This procedure is repeated dependent on the number of dimensions, with the next main component being the direction orthogonal to the most variable preceding components.
Reinforcement Learning
Reinforcement Learning (RL) is a type of machine learning that allows an agent to learn in an interactive setting via trial and error utilising feedback from its own actions and experiences.
Key terms in reinforcement learning
Some significant concepts describing the fundamental components of an RL issue are −
Environment − The physical surroundings in which an agent functions
Condition − The current standing of the agent
Reward − Environment-based feed-back
Policy − Mapping between agent state and actions
Value − The future compensation an agent would obtain for doing an action in a given condition.
Data Science Vs Machine Learning
Data Science is the study of data and how to derive meaningful insights from it, while machine learning is the study and development of models that use data to enhance performance or inform predictions. Machine learning is a subfield of artificial intelligence.
In recent years, machine learning and artificial intelligence (AI) have come to dominate portions of data science, playing a crucial role in data analytics and business intelligence. Machine learning automates data analysis and makes predictions based on the collection and analysis of massive volumes of data about certain populations using models and algorithms. Data Science and machine learning are related to each other, but not identical.
Data Science is a vast field that incorporates all aspects of deriving insights and information from data. It involves gathering, cleaning, analysing, and interpreting vast amount of data to discover patterns, trends, and insights that may guide business choices.
Machine learning is a subfield of data science that focuses on the development of algorithms that can learn from data and make predictions or judgements based on their acquired knowledge. Machine learning algorithms are meant to enhance their performance automatically over time by acquiring new knowledge.
In other words, data science encompasses machine learning as one of its numerous methodologies. Machine learning is a strong tool for data analysis and prediction, but it is just a subfield of data science as a whole.
Given below is the table of comparison for a clear understanding.
| Data Science | Machine Learning |
|---|---|
Data Science is a broad field that involves the extraction of insights and knowledge from large and complex datasets using various techniques, including statistical analysis, machine learning, and data visualization. |
Machine learning is a subset of data science that involves defining and developing algorithms and models that enable machines to learn from data and make predictions or decisions without being explicitly programmed. |
Data Science focuses on understanding the data, identifying patterns and trends, and extracting insights to support decision-making. |
Machine learning, on the other hand, focuses on building predictive models and making decisions based on the learned patterns. |
Data Science includes a wide range of techniques, such as data cleaning, data integration, data exploration, statistical analysis, data visualization, and machine learning. |
Machine learning, on the other hand, primarily focuses on building predictive models using algorithms such as regression, classification, and clustering. |
Data Science typically requires large and complex datasets that require significant processing and cleaning to derive insights. |
Machine learning, on the other hand, requires labelled data that can be used to train algorithms and models. |
Data Science requires skills in statistics, programming, and data visualization, as well as domain knowledge in the area being studied. |
Machine learning requires a strong understanding of algorithms, programming, and mathematics, as well as a knowledge of the specific application area. |
Data Science techniques can be used for a variety of purposes beyond prediction, such as clustering, anomaly detection, and data visualization |
Machine learning algorithms are primarily focused on making predictions or decisions based on data |
Data Science often relies on statistical methods to analyze data, |
Machine learning relies on algorithms to make predictions or decisions. |
Data Science - Data Analysis
What is Data Analysis in Data Science?
Data analysis is one of the key component of data science. Data analysis is described as the process of cleaning, converting, and modelling data to obtain actionable business intelligence. It uses statistical and computational methods to gain insights and extract information form the large amount of data. The objective of data analysis is to extract relevant information from data and make decisions based on this knowledge.
Although data analysis might incorporate statistical processes, it is often an ongoing, iterative process in which data are continually gathered and analyzed concurrently. In fact, researchers often assess observations for trends during the whole data gathering procedure. The particular qualitative technique (field study, ethnographic content analysis, oral history, biography, unobtrusive research) and the nature of the data decide the structure of the analysis.
To be more precise, Data analysis converts raw data into meaningful insights and valuable information which helps in making informed decisions in various fields like healthcare, education, business, etc.
Why Data Analysis is important?
Below is the list of reasons why is data analysis crucial today −
Accurate Data − We need data analysis that helps businesses acquire relevant and accurate information that they can use to plan business strategies and make informed decisions related to future plans and realign the companys vision and goal.
Better decision-making − Data analysis helps in making informed decisions by identifying patterns and trends in the data and providing valuable insights. This enables businesses and organizations to make data-driven decisions, which can lead to better outcomes and increased success.
Improved Efficiency − Analyzing data can help identify inefficiencies and areas for improvement in business operations, leading to better resource allocation and increased efficiency.
Competitive Advantage − By analyzing data, businesses can gain a competitive advantage by identifying new opportunities, developing new products or services, and improving customer satisfaction.
Risk Management − Analyzing data can help identify potential risks and threats to a business, enabling proactive measures to be taken to mitigate those risks.
Customer insights − Data analysis can provide valuable insights into customer behavior and preferences, enabling businesses to tailor their products and services to better meet customer needs.
Data Analysis Process
As the complexity and quantity of data accessible to business grows the complexity, so does the need for data analysis increases for cleaning the data and to extract relevant information that can be used by the businesses to make informed decisions.
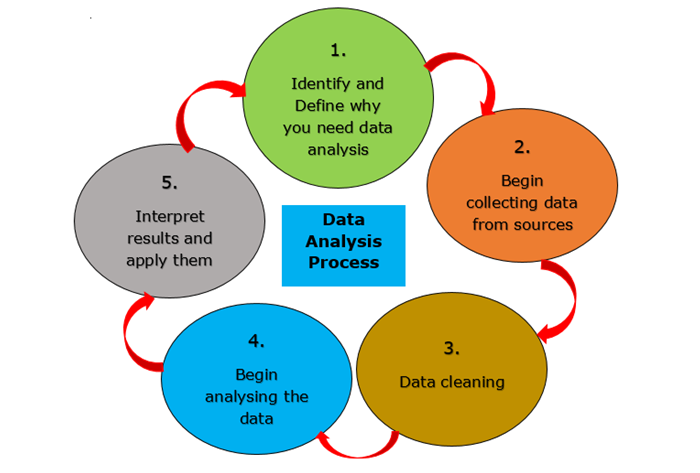
Typically, the data analysis process involves many iterative rounds. Let's examine each in more detail.
Identify − Determine the business issue you want to address. What issue is the firm attempting to address? What must be measured, and how will it be measured?
Collect − Get the raw data sets necessary to solve the indicated query. Internal sources, such as client relationship management (CRM) software, or secondary sources, such as government records or social media application programming interfaces, may be used to gather data (APIs).
Clean − Prepare the data for analysis by cleansing it. This often entails removing duplicate and anomalous data, resolving inconsistencies, standardizing data structure and format, and addressing white spaces and other grammatical problems.
Analyze the Data − You may begin to identify patterns, correlations, outliers, and variations that tell a narrative by transforming the data using different data analysis methods and tools. At this phase, you may utilize data mining to identify trends within databases or data visualization tools to convert data into an easily digestible graphical format.
Interpret − Determine how effectively the findings of your analysis addressed your initial query by interpreting them. Based on the facts, what suggestions are possible? What constraints do your conclusions have?
Types of Data Analysis
Data may be utilized to answer questions and assist decision making in several ways. To choose the optimal method for analyzing your data, you must have knowledge about the four types of data analysis widely used in the area might be helpful.
We will discuss each one in detail in the below sections −
Descriptive Analysis
Descriptive analytics is the process of looking at both current and past data to find patterns and trends. It's sometimes called the simplest way to look at data because it shows about trends and relationships without going into more detail.
Descriptive analytics is easy to use and is probably something almost every company does every day. Simple statistical software like Microsoft Excel or data visualisation tools like Google Charts and Tableau can help separate data, find trends and relationships between variables, and show information visually.
Descriptive analytics is a good way to show how things have changed over time. It also uses trends as a starting point for more analysis to help make decisions.
This type of analysis answers the question, What happened?.
Some examples of descriptive analysis are financial statement analysis, survey reports.
Diagnostic Analysis
Diagnostic analytics is the process of using data to figure out why trends and correlation between variables happen. It is the next step following identifying trends using descriptive analytics. You can do diagnostic analysis manually, with an algorithm, or with statistical software (such as Microsoft Excel).
Before getting into diagnostic analytics, you should know how to test a hypothesis, what the difference is between correlation and causation, and what diagnostic regression analysis is.
This type of analysis answers the question, Why did this happened?.
Some examples of diagnostic analysis are examining market demand, explaining customer behavior.
Predictive Analysis
Predictive analytics is the process of using data to try to figure out what will happen in the future. It uses data from the past to make predictions about possible future situations that can help make strategic decisions.
The forecasts might be for the near term or future, such as anticipating the failure of a piece of equipment later that day, or for the far future, such as projecting your company's cash flows for the next year.
Predictive analysis can be done manually or with the help of algorithms for machine learning. In either case, data from the past is used to make guesses or predictions about what will happen in the future.
Regression analysis, which may detect the connection between two variables (linear regression) or three or more variables, is one predictive analytics method (multiple regression). The connections between variables are expressed in a mathematical equation that may be used to anticipate the result if one variable changes.
Regression allows us to gain insights into the structure of that relationship and provides measures of how well the data fit that relationship. Such insights can be extremely useful for assessing past patterns and formulating predictions. Forecasting can help us to build data-driven plans and make more informed decisions.
This type of analysis answers the question, What might happen in the future?.
Some examples of predictive analysis are Marketing-behavioral targeting, Healthcare-early detection of a disease or an allergic reaction.
Prescriptive Analysis
Prescriptive analytics is the process of using data to figure out the best thing to do next. This type of analysis looks at all the important factors and comes up with suggestions for what to do next. This makes prescriptive analytics a useful tool for making decisions based on data.
In prescriptive analytics, machine-learning algorithms are often used to sort through large amounts of data faster and often more efficiently than a person can. Using "if" and "else" statements, algorithms sort through data and make suggestions based on a certain set of requirements. For example, if at least 50% of customers in a dataset said they were "very unsatisfied" with your customer service team, the algorithm might suggest that your team needs more training.
It's important to remember that algorithms can make suggestions based on data, but they can't replace human judgement. Prescriptive analytics is a tool that should be used as such to help make decisions and come up with strategies. Your judgement is important and needed to give context and limits to what an algorithm comes up with.
This type of analysis answers the question, What should we do next?.
Some examples of prescriptive analysis are: Investment decisions, Sales: Lead scoring.
Data Science - Tools in Demand
Data Science tools are used to dig deeper into raw and complicated data (unstructured or structured data) and process, extract, and analyse it to find valuable insights by using different data processing techniques like statistics, computer science, predictive modelling and analysis, and deep learning.
Data scientists use a wide range of tools at different stages of the data science life cycle to deal with zettabytes and yottabytes of structured and/or unstructured data every day and get useful insights from it. The most important thing about these tools is that they make it possible to do data science tasks without using complicated programming languages. This is because these tools have algorithms, functions, and graphical user interfaces that are already set up (GUIs).
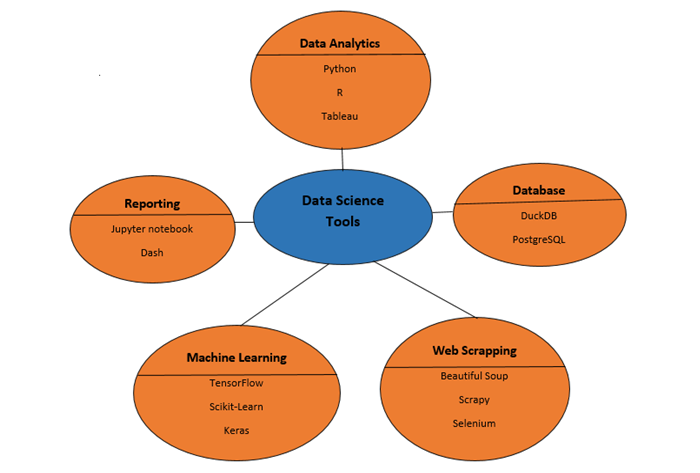
Best Data Science Tools
There are a lot of tools for data science in the market. So, it can be hard to decide which one is best for your journey and career. Below is the diagram that reperesents some of the best data science tools according to the need −
SQL
Data Science is the comprehensive study of data. To access data and work with it, data must be extracted from the database for which SQL will be needed. Data Science relies heavily on Relational Database Management. With SQL commands and queries, a Data Scientist may manage, define, alter, create, and query the database.
Several contemporary sectors have equipped their product data management with NoSQL technology, yet SQL remains the best option for many business intelligence tools and in-office processes.
DuckDB
DuckDB is a relational database management system based on tables that also lets you use SQL queries to do analysis. It is free and open source, and it has many features like faster analytical queries, easier operations, and so on.
DuckDB also works with programming languages like Python, R, Java, etc. that are used in Data Science. You can use these languages to create, register, and play with a database.
Beautiful Soup
Beautiful Soup is a Python library that can pull or extract information from HTML or XML files. It is an easy-to-use tool that lets you read the HTML content of websites to get information from them.
This library can help Data Scientists or Data Engineers set up automatic Web scraping, which is an important step in fully automated data pipelines.
It is mainly used for web scrapping.
Scrapy
Scrapy is an open-source Python web crawling framework that is used to scrape a lot of web pages. It is a web crawler that can both scrape and crawl the web. It gives you all the tools you need to get data from websites quickly, process them in the way you want, and store them in the structure and format you want.
Selenium
Selenium is a free, open-source testing tool that is used to test web apps on different browsers. Selenium can only test web applications, so it can't be used to test desktop or mobile apps. Appium and HP's QTP are two other tools that can be used to test software and mobile apps.
Python
Data Scientists use Python the most and it is the most popular programming language. One of the main reasons why Python is so popular in the field of Data Science is that it is easy to use and has a simple syntax. This makes it easy for people who don't have a background in engineering to learn and use. Also, there are a lot of open-source libraries and online guides for putting Data Science tasks like Machine Learning, Deep Learning, Data Visualization, etc. into action.
Some of the most commonly used libraries of python in data science are −
- Numpy
- Pandas
- Matplotlib
- SciPy
- Plotly
R
R is the second most-used programming language in Data Science, after Python. It was first made to solve problems with statistics, but it has since grown into a full Data Science ecosystem.
Most people use Dpylr and readr, which are libraries, to load data and change and add to it. ggplot2 allows you use different ways to show the data on a graph.
Tableau
Tableau is a visual analytics platform that is changing the way people and organizations use data to solve problems. It gives people and organizations the tools they need to extract the most out of their data.
When it comes to communication, tableau is very important. Most of the time, Data Scientists have to break down the information so that their teams, colleagues, executives, and customers can understand it better. In these situations, the information needs to be easy to see and understand.
Tableau helps teams dig deeper into data, find insights that are usually hidden, and then show that data in a way that is both attractive and easy to understand. Tableau also helps Data Scientists quickly look through the data, adding and removing things as they go so that the end result is an interactive picture of everything that matters.
Tensorflow
TensorFlow is a platform for machine learning that is open-source, free to use and uses data flow graphs. The nodes of the graph are mathematical operations, and the edges are the multidimensional data arrays (tensors) that flow between them. The architecture is so flexible; machine learning algorithms can be described as a graph of operations that work together. They can be trained and run on GPUs, CPUs, and TPUs on different platforms, like portable devices, desktops, and high-end servers, without changing the code. This means that programmers from all kinds of backgrounds can work together using the same tools, which makes them much more productive. The Google Brain Team created the system to study machine learning and deep neural networks (DNNs). However, the system is flexible enough to be used in a wide range of other fields as well.
Scikit-learn
Scikit-learn is a popular open-source Python library for machine learning that is easy to use. It has a wide range of supervised and unsupervised learning algorithms, as well as tools for model selection, evaluation, and data preprocessing. Scikit-learn is used a lot in both academia and business. It is known for being fast, reliable, and easy to use.
It also has features for reducing the number of dimensions, choosing features, extracting features, using ensemble techniques, and using datasets that come with the program. We will look at each of these things in turn.
Keras
Google's Keras is a high-level deep learning API for creating neural networks. It is built in Python and is used to facilitate neural network construction. Moreover, different backend neural network computations are supported.
Since it offers a Python interface with a high degree of abstraction and numerous backends for computation, Keras is reasonably simple to understand and use. This makes Keras slower than other deep learning frameworks, but very user-friendly for beginners.
Jupyter Notebook
Jupyter Notebook is an open-source online application that allows the creation and sharing of documents with live code, equations, visualisations, and narrative texts. It is popular among data scientists and practitioners of machine learning because it offers an interactive environment for data exploration and analysis.
With Jupyter Notebook, you can write and run Python code (and code written in other programming languages) right in your web browser. The results are shown in the same document. This lets you put code, data, and text explanations all in one place, making it easy to share and reproduce your analysis.
Dash
Dash is an important tool for data science because it lets you use Python to create interactive web apps. It makes it easy and quick to create data visualisation dashboards and apps without having to know how to code for the web.
SPSS
SPSS, which stands for "Statistical Package for the Social Sciences," is an important tool for data science because it gives both new and experienced users a full set of statistical and data analysis tools.
Data Science - Careers
There are several jobs available that are linked to or overlap with the field of data scientist.
List of jobs related to data science −
Below is a list of jobs that are related to data scientists.
Data Analyst
Data Scientist
Database Administrator
Big Data Engineer
Data Mining Engineer
Machine Learning Engineer
Data Architect
Hadoop Engineer
Data Warehouse Architect
Data Analyst
A data analyst analyses data sets to identify solutions to customer-related issues. This information is also communicated to management and other stakeholders by a data analyst. These people work in a variety of fields, including business, banking, criminal justice, science, medical, and government.
A data analyst is someone who has the expertise and abilities to transform raw data into information and insight that can be utilized to make business choices.
Data Scientist
A Data Scientist is a professional who uses analytical, statistical, and programming abilities to acquire enormous volumes of data. It is their obligation to utilize data to create solutions that are personalized to the organization's specific demands.
Companies are increasingly relying on data in their day-to-day operations. A data scientist examines raw data and pulls meaningful meaning from it. They then utilize this data to identify trends and provide solutions that a business needs to grow and compete.
Database Administrator
Database administrators are responsible for managing and maintaining business databases. Database administrators are responsible for enforcing a data management policy and ensuring that corporate databases are operational and backed up in the case of memory loss.
Database administrators (sometimes known as database managers) administer business databases to ensure that information is maintained safely and is only accessible to authorized individuals. Database administrators must also guarantee that these persons have access to the information they need at the times they want it and in the format they require.
Big Data Engineer
Big data engineers create, test, and maintain solutions for a company that use Big Data. Their job is to gather a lot of data from many different sources and make sure that people who use the data later can get to it quickly and easily. Big data engineers basically make sure that the company's data pipelines are scalable, secure, and able to serve more than one user.
The amount of data made and used today seems to be endless. The question is how this information will be saved, analyzed, and shown. A big data engineer works on the methods and techniques to deal with these problems.
Data Mining Engineer
Data mining is the process of sorting through information to find answers that a business can use to improve its systems and operations. Data isn't very useful if it isn't manipulated and shown in the right way.
A data mining engineer sets up and runs the systems that are used to store and analyze data. Overarching tasks include setting up data warehouses, organizing data so it's easy to find, and installing conduits for data to flow through. A data mining engineer needs to know where the data comes from, how it will be used, and who will use it. ETL, which stands for "extract, transform, and load," is the key acronym for a data mining engineer.
Machine Learning Engineer
A machine learning (ML) developer knows how to train models with data. The models are then used to automate things like putting images into groups, recognising speech, and predicting the market.
Different roles can be given to machine learning. There is often some overlap between the jobs of a data scientist and an AI (artificial intelligence) engineer, and sometimes the two jobs are even confused with each other. Machine learning is a subfield of AI that focuses on looking at data to find connections between what was put in and what was wanted to come out.
A machine learning developer makes sure that each problem has a solution that fits it perfectly. Only by carefully processing the data and choosing the best algorithm for the situation can you get the best results.
Data Architect
Data architects build and manage a company's database by finding the best ways to set it up and structure it. They work with database managers and analysts to make sure that company data is easy to get to. Tasks include making database solutions, figuring out what needs to be done, and making design reports.
A data architect is an expert who comes up with the organization's data strategy, which includes standards for data quality, how data moves around the organisation, and how data is kept safe. The way this professional in data management sees things is what turns business needs into technical needs.
As the key link between business and technology, data architects are becoming more and more in demand.
Hadoop Engineer
Hadoop Developers are in charge of making and coding Hadoop applications. Hadoop is an open-source framework for managing and storing applications that work with large amounts of data and run on cluster systems. Basically, a Hadoop developer makes apps that help a company manage and keep track of its big data.
A Hadoop Developer is the person in charge of writing the code for Hadoop applications. This job is like being a Software Developer. The jobs are pretty similar, but the first one is in the Big Data domain. Let's look at some of the things a Hadoop Developer has to do to get a better idea of what this job is about.
Data Warehouse Architect
Data warehouse architects are responsible coming up with solutions for data warehouses and working with standard data warehouse technologies to come up with plans that will help a business or organization the most. When designing a specific architecture, data warehouse architects usually take into account the goals of the employer or the needs of the client. This architecture can then be maintained by the staff and used to achieve the goals.
So, just like a regular architect designs a building or a naval architect designs a ship, data warehouse architects design and help launch data warehouses, customizing them to meet the needs of the client.
Data Science Job Trends 2022
By 2022, there will be a big rise in the need for data scientists. IBM says that between 364,000 and 2,720,000 new jobs will be created in the year 2020. This demand will continue to rise, and soon there will be a 700,000 openings.
Glassdoor says that the top job on its site is for a Data Scientist. In the future, nothing will change about this position. It is also looked at that the job openings in data science are open for 45 days. This is five days longer than the average job market.
IBM will work with schools and businesses to create a work-study environment for aspiring data scientists. This will help close the skills gap.
The need for data scientists is growing at a rate that is a power of two. This is because new jobs and industries have been created. This is made worse by the growing amount of data and the different kinds of data.
In the future, there will only be more roles for data scientists and more of them. Data scientist jobs include data engineer, data science manager, and big data architect. Also, the financial and insurance sectors are becoming some of the biggest employers of data scientists.
As the number of institutes that train data scientists grows, it is likely that more and more people will know how to use data.
Data Science - Scientists
A data scientist is a trained professional who analyzes and makes sense of data. They use their knowledge of data science to help businesses make better decisions and run better. Most data scientists have a lot of experience with math, statistics, and computer science. They use this information to look at big sets of data and find trends or patterns. Data scientists might also come up with new ways to collect and store data.
How to become a Data Scientist?
There is a big need for people who know how to use data analysis to give their companies a competitive edge. As a data scientist, you will make business solutions and analytics that are based on data.
There are many ways to become a Data Scientist, but because it's usually a high-level job, most Data Scientists have degrees in math, statistics, computer science, and other related fields.
Below are some steps to become a data scientist −
Step 1 − Right Data Skills
You can become a Data Scientist if you have no data-related job experience, but you will need to acquire the necessary foundation to pursue a data science profession.
A Data Scientist is a high-level role; prior to attaining this level of expertise, you should acquire a comprehensive knowledge foundation in a related topic. This might include mathematics, engineering, statistics, data analysis, programming, or information technology; some Data Scientists began their careers in banking or baseball scouting.
But regardless of the area you begin in, you should begin with Python, SQL, and Excel. These abilities will be important for processing and organizing raw data. It is beneficial to be acquainted with Tableau, a tool you will use often to build visuals.
Step 2 − Learn Data Science Fundamentals
A data science boot camp might be a perfect approach to learn or improve upon the principles of data science. You can refer Data Science BootCamp which has each and every topic covered in detail.
Learn data science fundamentals such as how to gather and store data, analyze and model data, and display and present data using every tool in the data science arsenal, such as Tableau and PowerBI, among others.
You should be able to utilize Python and R to create models that assess behavior and forecast unknowns, as well as repackage data in user-friendly formats, by the conclusion of your training.
Several Data Science job listings state advanced degrees as a prerequisite. Sometimes, this is non-negotiable, but when demand exceeds supply, this increasingly reveals the truth. That is, proof of the necessary talents often surpasses credentials alone.
Hiring managers care most about how well you can show that you know the subject, and more and more people are realizing that this doesn't have to be done in the traditional ways.
Data Science Fundamentals
Collect and store data.
Analyze and model the data.
Build a model that can make prediction using the given data.
Visualizing and presenting data in user-friendly forms.
Step 3 − Learn Key Programming Languages for Data Science
Data Scientists use a variety of tools and programs that were made just for cleaning, analyzing, and modeling data. Data Scientists need to know more than just Excel. They also need to know a statistical programming language like Python, R, or Hive, as well as a query language like SQL.
RStudio Server, which provides a development environment for working with R on a server, is one of the most important tools for a Data Scientist. Another popular software is the open-source Jupyter Notebook, which can be used for statistical modeling, data visualization, machine learning, and more.
Machine learning is being used most in data science. This refers to tools that use artificial intelligence to give systems the ability to learn and get better without being specifically programmed to do so.
Step 4 − Learn how to do visualizations and practice them
Practice making your own visualizations from scratch with programs like Tableau, PowerBI, Bokeh, Plotly, or Infogram. Find the best way to let the data speak for itself.
Excel is generally used in this step. Even though the basic idea behind spreadsheets is simple-making calculations or graphs by correlating the information in their cells-Excel is still very useful after more than 30 years, and it is almost impossible to do data science without it.
But making beautiful pictures is just the start. As a Data Scientist, you'll also need to be able to use these visualizations to show your findings to a live audience. You may have these communication skills already, but if not, don't worry. Anyone can get better with practice. If you need to, start small by giving presentations to one friend or even your pet before moving on to a group.
Step 5 − Work on some Data Science projects that will help develop your practical data skills
Once you know the basics of the programming languages and digital tools that Data Scientists use, you can start using them to practice and improve your new skills. Try to take on projects that require a wide range of skills, like using Excel and SQL to manage and query databases and Python and R to analyze data using statistical methods, build models that analyze behavior and give you new insights, and use statistical analysis to predict things you don't know.
As you practice, try to cover different parts of the process. Start with researching a company or market sector, then define and collect the right data for the task at hand. Finally, clean and test that data to make it as useful as possible.
Lastly, you can make and use your own algorithms to analyze and model the data. You can then put the results into easy-to-read visuals or dashboards that users can use to interact with your data and ask questions about it. You could even try showing your findings to other people to get better at communicating.
You should also get used to working with different kinds of data, like text, structured data, images, audio, and even video. Every industry has its own types of data that help leaders make better, more informed decisions.
As a working Data Scientist, you'll probably be an expert in just one or two, but as a beginner building your skillset, you'll want to learn the basics of as many types as possible.
Taking on more complicated projects will give you the chance to see how data can be used in different ways. Once you know how to use descriptive analytics to look for patterns in data, you'll be better prepared to try more complicated statistical methods like data mining, predictive modelling, and machine learning to predict future events or even make suggestions.
Step 6 − Make a Portfolio that shows your Data Science Skills
Once you've done your preliminary research, gotten the training, and practiced your new skills by making a wide range of impressive projects, the next step is to show off your new skills by making the polished portfolio that will get you your dream job.
In fact, your portfolio might be the most important thing you have when looking for a job. If you want to be a Data Scientist, you might want to show off your work on GitHub instead of (or in addition to) your own website. GitHub makes it easy to show your work, process, and results while also raising your profile in a public network. Don't stop there, though.
Include a compelling story with your data and show the problems you're trying to solve so the employer can see how good you are. You can show your code in a bigger picture on GitHub instead of just by itself, which makes your contributions easier to understand.
Don't list all of your work when you're applying for a specific job. Highlight just a few pieces that are most relevant to the job you're applying for and that best show your range of skills throughout the whole data science process, from starting with a basic data set to defining a problem, cleaning up, building a model, and finding a solution.
Your portfolio is your chance to show that you can do more than just crunch numbers and communicate well.
Step 7 − Demonstrate Your Abilities
A well-done project that you do on your own can be a great way to show off your skills and impress hiring managers who might hire you.
Choose something that really interests you, ask a question about it, and try to answer that question with data.
Document your journey and show off your technical skills and creativity by presenting your findings in a beautiful way and explaining how you got there. Your data should be accompanied by a compelling narrative that shows the problems you've solved, highlighting your process and the creative steps you've taken, so that an employer can see your worth.
Joining an online data science network like Kaggle is another great way to show that you're involved in the community, show off your skills as an aspiring Data Scientist, and continue to grow both your expertise and your reach.
Step 8 − Start Applying to Data Science Jobs
There are many jobs in the field of data science. After learning the basics, people often go on to specialize in different subfields, such as Data Engineers, Data Analysts, or Machine Learning Engineers, among many others.
Find out what a company values and what they're working on, and make sure it fits with your skills, goals, and what you want to do in the future. And don't just look in Silicon Valley. Cities like Boston, Chicago, and New York are having trouble finding technical talent, so there are lots of opportunities.
Data Scientist - Salary
As digitalization has spread around the world, data science has become one of the best-paying jobs in the world. In India, data scientists make between 1.8 Lakhs and 1 Crore a year, depending on their qualifications, skills, and experience.
Top Factors that decide Data Scientist Salaries
There are a few things that affect the salary of a data scientist. Of course, what matters most is your experience, but a data scientist's salary in India is also based on their skills, job roles, the company they work for, and where they live.
Salary Based on Skills
The data science salary in India is also based on how skilled you are in the pitch. The more skills you have in your field, the more likely you are to get a higher salary. Even the starting salary for a data scientist in India is higher for people with different IT skills. Recruiters will notice you more if your resume stands out. You might be able to get a higher salary if you have skills like Machine Learning, Python, Statistical Analysis, and Big Data Analytics.
Salary Based on the Experience
When it comes to data science jobs salaries in India, experience is a main factor. PayScale says that the average salary for a new data scientist in India with less than one year of experience is about 5,77,893. The average salary for someone with 14 years of experience is 8,09,952. With 59 years of experience, a data scientist in the middle of their career could make up to 14,48,144 per year. And in India, a person with 119 years of experience in the pitch can make an average of 19,44,566 per year.
Salary Based on Location
Location is another factor that affects how much you get paid for a data science job in India. There are a lot of big cities in India that hire data scientists, but the packages vary from city to city.
Salary Based on Companies
Many companies hire data scientists on a regular basis, but most of the time, they have different jobs or roles. If you work for one of these companies, your salary will depend on what job you get. Other companies in India also pay their data scientists different salaries each year. Before you accept a job offer, you can always find out how much a data scientist in India makes per month or per year at other companies.
Data Scientist Salary in India
Given below is the table that shows the average salary of different data science profiles in India −
| S.No | Job Title | Average Annual Base Salary in India |
|---|---|---|
| 1 | Data Scientist |
10.0 LPA |
| 2 | Data Architect |
24.7 LPA |
3 | Data Engineer |
8.0 LPA |
| 4 | Data Analyst | 4.2 LPA |
| 5 | Database Administrator |
10.0 LPA |
| 6 | Machine Learning Engineer |
6.5 LPA |
The data in the table above is taken from Ambition Box.
Data Scientist Salary in USA
Given below is the table that shows the average salary of different data science profiles in USA −
| S.No | Job Title | Average Annual Base Salary in USA |
|---|---|---|
| 1 | Data Scientist |
$123,829 |
| 2 | Data Architect | $1,28,205 |
| 3 | Data Engineer |
$126,443 |
4 | Data Analyst | $71,047 |
| 5 | Database Administrator |
$90,078 |
| 6 | Machine Learning Engineer |
$146,799 |
The data in the table above is taken from Indeed.
The United States of America pays the highest data scientist salaries on average, followed by Australia, Canada, and Germany.
According to Payscale, an entry-level Data Scientist with less than 1-year experience can expect to earn an average total compensation (includes tips, bonus, and overtime pay) of 589,126 based on 498 salaries. An early career Data Scientist with 1-4 years of experience earns an average total compensation of 830,781 based on 2,250 salaries. A mid-career Data Scientist with 5-9 years of experience earns an average total compensation of 1,477,290 based on 879 salaries. An experienced Data Scientist with 10-19 years of experience earns an average total compensation of 1,924,803 based on 218 salaries. In their late career (20 years and higher), employees earn an average total compensation of 1,350,000.
In recent years, improvements in technology have made Data Science more important in many different fields of work. Data Science is used for more than just collecting and analyzing data. It is now a multidisciplinary field with many different roles. With high salaries and guaranteed career growth, more and more people are getting into the field of data science every day.
Data Science - Resources
This article lists the best programs and courses in data science that you can take to improve your skills and get one of the best data scientist jobs in 2023. You should take one of these online courses and certifications for data scientists to get started on the right path to mastering data science.
Top Data Science Courses
In this section we will discuss some the popular courses for data science that are available on the internet.
A variety of factors/aspects were considered when producing the list of top data science courses for 2023, including −
Curriculum Covered − The list is compiled with the breadth of the syllabus in mind, as well as how effectively it has been tailored to fit varied levels of experience.
Course Features and Outcomes − We have also discussed the course outcomes and other aspects, such as Query resolve, hands-on projects, and so on, that will help students obtain marketable skills.
Course Length − We have calculated the length of each course.
Skills Required − We have addressed the required skills that applicants must have in order to participate in the course.
Course Fees − Each course is graded based on its features and prices to ensure that you get the most value for your money.
Mastering the A-Z of Data Science & Machine LearningCourse Highlights
Covers all areas of data science, beginning with the fundamentals of programming (binary, loops, number systems, etc.) and on through intermediate programming subjects (arrays, OOPs, sorting, recursion, etc.) and ML Engineering (NLP, Reinforcement Learning, TensorFlow, Keras, etc.).
Lifetime access.
30-Days Money Back Guarantee.
After completion certificate.
Course Duration: 94 hours.
Check the course details here
Mastering Python for Data Science & Data Analysis
Course Highlights
This course will enable you to build a Data Science foundation, whether you have basic Python skills or not. The code-along and well planned-out exercises will make you comfortable with the Python syntax right from the outset. At the end of this short course, youll be proficient in the fundamentals of Python programming for Data Science and Data Analysis.
In this truly step-by-step course, every new tutorial video is built on what you have already learned. The aim is to move you one extra step forward at a time, and then, you are assigned a small task that is solved right at the beginning of the next video. That is, you start by understanding the theoretical part of a new concept first. Then, you master this concept by implementing everything practically using Python.
Become a Python developer and Data Scientist by enrolling in this course. Even if you are a novice in Python and data science, you will find this illustrative course informative, practical, and helpful. And if you arent new to Python and data science, youll still find the hands-on projects in this course immensely helpful.
Course Duration: 14 hour
Check course details here.
R Programming for Data Science
Course Description
The course demonstrates the importance and advantages of R language as a start, then it presents topics on R data types, variable assignment, arithmetic operations, vectors, matrices, factors, data frames and lists. Besides, it includes topics on operators, conditionals, loops, functions, and packages. It also covers regular expressions, getting and cleaning data, plotting, and data manipulation using the dplyr package.
Lifetime access.
30-Days Money Back Guarantee.
After completion certificate.
Course Duration: 6 hours
Check the course details here.
In this course you will learn about −
Life Cycle of a Data Science Project.
Python libraries like Pandas and Numpy used extensively in Data Science.
Matplotlib and Seaborn for Data Visualization.
Data Preprocessing steps like Feature Encoding, Feature Scaling etc...
Machine Learning Fundamentals and different algorithms
Cloud Computing for Machine Learning
Deep Learning
5 projects like Diabetes Prediction, Stock Price Prediction etc...
Course Duration: 7 hours
Check the course details here.
Mastering Data Science with Pandas
Course Description
This Course of Pandas offers a complete view of this powerful tool for implementing data analysis, data cleaning, data transformation, different data formats, text manipulation, regular expressions, data I/O, data statistics, data visualization, time series and more.
This course is a practical course with many examples because the easiest way to learn is by practicing! then we'll integrate all the knowledge we have learned in a Capstone Project developing a preliminary analysis, cleaning, filtering, transforming, and visualizing data using the famous IMDB dataset.
Course Duration: 6 hours
Check the course details here.
Python and Analytics for Data Science.
This course is meant for beginners and intermediates who wants to expert on Python programming concepts and Data Science libraries for analysis, machine Learning models etc.
They can be students, professionals, Data Scientist, Business Analyst, Data Engineer, Machine Learning Engineer, Project Manager, Leads, business reports etc.
The course have been divided into 6 parts - Chapters, Quizzes, Classroom Hands-on Exercises, Homework Hands-on Exercises, Case Studies and Projects.
Practice and Hands-on concepts through Classroom, Homework Assignments, Case Studies and Projects
This Course is ideal for anyone who is starting their Data Science Journey and building ML models and Analytics in future.
This course covers all the important Python Fundamentals and Data Science Concepts requires to succeed in Academics and Corporate Industry.
Opportunity to Apply Data Science Concepts in 3 Real World Case Studies and 2 Real World Projects.
The 3 Case Studies are on Loan Risk Analysis, Churn Prediction and Customer Segmentation.
The 2 Projects are on Titanic Dataset and NYC Taxi Trip Duration.
Course Duration: 8.5 hours
Check the course details here.
Data Science-Fundamentals of Statistics
Course Description
Students will gain knowledge about the basics of statistics
They will have a clear understanding of different types of data with examples which is very important to understand data analysis
Students will be able to analyze, explain and interpret the data
They will understand the relationship and dependency by learning Pearson's correlation coefficient, scatter diagram, and linear regression analysis between the variables and will be able to know to make the prediction
Students will understand the different methods of data analysis such as a measure of central tendency (mean, median, mode), a measure of dispersion (variance, standard deviation, coefficient of variation), how to calculate quartiles, skewness, and box plot
They will have a clear understanding of the shape of data after learning skewness and box plot, which is an important part of data analysis
Students will have a basic understanding of probability and how to explain and understand Bayes theorem with the simplest example
Course Duration: 7 hours
Check the course details here.
Top Data Science ebooks
In this section we will discuss some the popular ebooks for data science that are available on the internet.
Beginners Course on Data Science
In this book, you'll find everything you need to know to get started with data science and become proficient with its methods and tools. Understanding data science and how it aids prediction is crucial in today's fast-paced world. The purpose of this book is to provide a high-level overview of data science and its methodology.Data Science has its origins in statistics. However, expertise in programming, business, and statistics is necessary for success in this arena. The best way to learn is to familiarize yourself with each subject at length.
Finding trends and insights within a dataset is an age-old art. The ancient Egyptians used census information to better levy taxes. Nile flood predictions were also made using data analysis. Finding a pattern or exciting nugget of information in a dataset requires looking back at the data that came before it. The company will be able to use this information to make better choices.The need for data scientists is no longer hidden; if you enjoy analyzing numerical information, this is your field. Data Science is a growing field, and if you decide to pursue an education in it, you should jump at the chance to work in it as soon as it presents itself.
Check the ebook here.
Building Data Science Solutions With Anaconda
In this book, you'll learn how using Anaconda as the easy button, can give you a complete view of the capabilities of tools such as conda, which includes how to specify new channels to pull in any package you want as well as discovering new open source tools at your disposal. Youll also get a clear picture of how to evaluate which model to train and identify when they have become unusable due to drift. Finally, youll learn about the powerful yet simple techniques that you can use to explain how your model works.
By the end of this book, youll feel confident using conda and Anaconda Navigator to manage dependencies and gain a thorough understanding of the end-to-end data science workflow.
Check the ebook here.
Practical Data Science With Python
The book starts with an overview of basic Python skills and then introduces foundational data science techniques, followed by a thorough explanation of the Python code needed to execute the techniques. You'll understand the code by working through the examples. The code has been broken down into small chunks (a few lines or a function at a time) to enable thorough discussion.
As you progress, you will learn how to perform data analysis while exploring the functionalities of key data science Python packages, including pandas, SciPy, and scikit-learn. Finally, the book covers ethics and privacy concerns in data science and suggests resources for improving data science skills, as well as ways to stay up to date on new data science developments.
By the end of the book, you should be able to comfortably use Python for basic data science projects and should have the skills to execute the data science process on any data source.
Check the ebook here.
Cleaning Data for Effective Data Science
The book dives into the practical application of tools and techniques needed for data ingestion, anomaly detection, value imputation, and feature engineering. It also offers long-form exercises at the end of each chapter to practice the skills acquired.
You will begin by looking at data ingestion of data formats such as JSON, CSV, SQL RDBMSes, HDF5, NoSQL databases, files in image formats, and binary serialized data structures. Further, the book provides numerous example data sets and data files, which are available for download and independent exploration.
Moving on from formats, you will impute missing values, detect unreliable data and statistical anomalies, and generate synthetic features that are necessary for successful data analysis and visualization goals.
By the end of this book, you will have acquired a firm understanding of the data cleaning process necessary to perform real-world data science and machine learning tasks.
Check the ebook here.
Essentials of Data Science And Analytics
This book combines the key concepts of data science and analytics to help you gain a practical understanding of these fields. The four different sections of the book are divided into chapters that explain the core of data science. Given the booming interest in data science, this book is timely and informative.
Check the ebook here.
Data Science - Interview Questions
Below are some most commonly asked questions in the interviews.
Q1. What is data science and how is it different from other data-related fields?
Data Science is the domain of study that uses computational and statistical methods to get knowledge and insights from data. It utilizes techniques from mathematics, statistics, computer science and domain-specific knowledge to analyse large datasets, find trends and patterns from the data and make predictions for the future.
Data Science is different from other data related fields because it is not only about collecting and organising data. The data science process consists of analysing, modelling, visualizing and evaluating the data set. Data Science uses tools like machine learning algorithms, data visualisation tools and statistical models to analyse data, make predictions and find patterns and trends in the data.
Other data related fields such as machine learning, data engineering and data analytics are more focused on a particular thing like the goal of a machine leaning engineer is to design and create algorithms that are capable of learning from the data and making predictions, the goal of data engineering is to design and manage data pipelines, infrastructures and databases. Data analysis is all about exploring and analysing data to find patterns and trends. Whereas data science does modelling, exploring, collecting, visualizing, predicting, and deploying the model.
Overall, data science is a more comprehensive way to analyse data because it includes the whole process, from preparing the data to making predictions. Other fields that deal with data have more specific areas of expertise.
Q2. What is the data science process and what are the key steps involved?
A data science process also known as data science lifecycle is a systematic approach to find a solution for a data problem which shows the steps that are taken to develop, deliver, and maintain a data science project.
A standard data science lifecycle approach comprises the use of machine learning algorithms and statistical procedures that result in more accurate prediction models. Data extraction, preparation, cleaning, modelling, assessment, etc., are some of the most important data science stages. Key steps involved in data science process are −
Identifying Problem and Understanding the Business
The data science lifecycle starts with "why?" just like any other business lifecycle. One of the most important parts of the data science process is figuring out what the problems are. This helps to find a clear goal around which all the other steps can be made. In short, it's important to know the business goal as earliest because it will determine what the end goal of the analysis will be.
Data Collection
The next step in the data science lifecycle is data collection, which means getting raw data from the appropriate and reliable source. The data that is collected can be either organized or unorganized. The data could be collected from website logs, social media data, online data repositories, and even data that is streamed from online sources using APIs, web scraping, or data that could be in Excel or any other source.
Data Processing
After collecting high-quality data from reliable sources, next step is to process it. The purpose of data processing is to ensure that any problems with the acquired data have been resolved before proceeding to the next phase. Without this step, we may produce mistakes or inaccurate findings.
Data Analysis
Data analysis Exploratory Data Analysis (EDA) is a set of visual techniques for analysing data. With this method, we may get specific details on the statistical summary of the data. Also, we will be able to deal with duplicate numbers, outliers, and identify trends or patterns within the collection.
Data Visualization
Data visualisation is the process of demonstrating information and data on a graph. Data visualisation tools make it easy to understand trends, outliers, and patterns in data by using visual elements like charts, graphs, and maps. It's also a great way for employees or business owners to present data to people who aren't tech-savvy without making them confused.
Data Modelling
Data Modelling is one of the most important aspects of data science and is sometimes referred to as the core of data analysis. The intended output of a model should be derived from prepared and analysed data.
At this phase, we develop datasets for training and testing the model for production-related tasks. It also involves selecting the correct mode type and determining if the problem involves classification, regression, or clustering. After analysing the model type, we must choose the appropriate implementation algorithms. It must be performed with care, as it is crucial to extract the relevant insights from the provided data.
Model Deployment
Model deployment contains the establishment of a delivery method necessary to deploy the model to market consumers or to another system. Machine learning models are also being implemented on devices and gaining acceptance and appeal. Depending on the complexity of the project, this stage might range from a basic model output on a Tableau Dashboard to a complicated cloud-based deployment with millions of users.
Q3. What is the difference between supervised and unsupervised learning?
Supervised Learning − Supervised learning is a type of machine learning and artificial intelligence. It is also called "supervised machine learning." It is defined by the fact that it uses labelled datasets to train algorithms how to correctly classify data or predict outcomes. As data is put into the model, its weights are changed until the model fits correctly. This is part of the cross validation process. Supervised learning helps organisations find large-scale solutions to a wide range of real-world problems, like classifying spam in a separate folder from your inbox like in Gmail we have a spam folder.
Supervised Learning Algorithms − Naive Bayes, Linear regression, Logistic regression.
Unsupervised learning − Unsupervised learning, also called unsupervised machine learning, uses machine learning algorithms to look at unlabelled datasets and group them together. These programmes find hidden patterns or groups of data. Its ability to find similarities and differences in information makes it perfect for exploratory data analysis, cross-selling strategies, customer segmentation, and image recognition.
Unsupervised Learning Algorithms − K-means clustering
Q4. What is regularization and how does it help to avoid overfitting?
Regularization is a method that adds information to a model to stop it from becoming overfitted. It is a type of regression that tries to get the estimates of the coefficients as close to zero as possible to make the model smaller. In this case, taking away extra weights is what it means to reduce a model's capacity.
Regularization takes away any extra weights from the chosen features and redistributes the weights so that they are all the same. This means that regularisation makes it harder to learn a model that is both flexible and has a lot of moving parts. A model with a lot of flexibility is one that can fit as many data points as possible.
Q5. What is cross-validation and why is it important in machine learning?
Cross-validation is a technique to test ML models by training them on different subsets of the available input data and then testing them on the other subset. We can use cross-validation to detect overfitting, ie, failing to generalise a pattern.
For cross-validation, we can use the k-fold cross-validation method. In k-fold cross-validation, we divide the data you start with into k groups (also known as folds). We train an ML model on all but one (k-1) of the subsets, and then we test the model on the subset that wasn't used for training. This process is done k times, and each time a different subset is set aside for evaluation (and not used for training).
Q6. What is the difference between classification and regression in machine learning?
The major difference between regression and classification is that regression helps predict a continuous quantity, while classification helps predict discrete class labels. Some components of the two kinds of machine learning algorithms are also the same.
A regression algorithm can make a prediction about a discrete value, which is a whole number.
If the value is in the form of a class label probability, a classification algorithm can predict this type of data.
Q7. What is clustering and what are some popular clustering algorithms?
Clustering is a method for data mining that organises unlabelled data based on their similarities or differences. Clustering techniques are used to organise unclassified, unprocessed data items into groups according to structures or patterns in the data. There are many types of clustering algorithms, including exclusive, overlapping, hierarchical, and probabilistic.
K-means clustering is a popular example of a clustering approach in which data points are allocated to K groups based on their distance from each group's centroid. The data points closest to a certain centroid will be grouped into the same category. A higher K number indicates smaller groups with more granularity, while a lower K value indicates bigger groupings with less granularity. Common applications of K-means clustering include market segmentation, document clustering, picture segmentation, and image compression.
Q8. What is gradient descent and how does it work in machine learning?
Gradient descent is an optimisation algorithm that is often used to train neural networks and machine learning models. Training data helps these models learn over time, and the cost function in gradient descent acts as a barometer to measure how accurate it is with each iteration of parameter updates. The model will keep changing its parameters to make the error as small as possible until the function is close to or equal to 0. Once machine learning models are tuned to be as accurate as possible, they can be used in artificial intelligence (AI) and computer science in powerful ways.
Q9. What is A/B testing and how can it be used in data science?
A/B testing is a common form of randomised controlled experiment. It is a method for determining which of two versions of a variable performs better in a controlled setting. A/B testing is one of the most important concepts in data science and the technology industry as a whole since it is one of the most efficient approaches for drawing conclusions regarding any hypothesis. It is essential that you comprehend what A/B testing is and how it normally works. A/B testing is a common method for evaluating goods and is gaining momentum in the area of data analytics. A/B testing is more effective when testing incremental changes such as UX modifications, new features, ranking, and page load speeds.
Q10. Can you explain overfitting and underfitting, and how to mitigate them?
Overfitting is a modelling error that arises when a function is overfit to a restricted number of data points. It is the outcome of a model with an excessive amount of training points and excessive complexity.
Underfitting is a modelling error that arises when a function does not properly match the data points. That is the outcome of a simple model with inadequate training points.
There are a number of ways that researchers in machine learning can avoid overfitting. These include: Cross-validation, Regularization, Pruning, Dropout.
There are a number of ways that researchers in machine learning can avoid underfitting. These include −
Get more training data.
Add more parameters or increase size of the parameters.
Make the model more complex.
Adding more time to training until the cost function is at its lowest.
With these methods, you should be able to make your models better and fix any problems with overfitting or underfitting.
