- Data Science - Home
- Data Science - Getting Started
- Data Science - What is Data?
- Data science - Lifecycle
- Data Science - Prerequisites
- Data Science - Applications
- Data Science - Machine Learning
- Data Science - Data Analysis
- Data Science - Tools in Demand
- Data Science - Careers
- Data Science - Scientists
- Data Scientist - Salary
- Data Science - Resources
- Data Science - Interview Questions
- Data Science Useful Resources
- Data Science - Quick Guide
- Data Science - Useful Resources
- Data Science - Discussion
Data Science - Data Analysis
What is Data Analysis in Data Science?
Data analysis is one of the key component of data science. Data analysis is described as the process of cleaning, converting, and modelling data to obtain actionable business intelligence. It uses statistical and computational methods to gain insights and extract information form the large amount of data. The objective of data analysis is to extract relevant information from data and make decisions based on this knowledge.
Although data analysis might incorporate statistical processes, it is often an ongoing, iterative process in which data are continually gathered and analyzed concurrently. In fact, researchers often assess observations for trends during the whole data gathering procedure. The particular qualitative technique (field study, ethnographic content analysis, oral history, biography, unobtrusive research) and the nature of the data decide the structure of the analysis.
To be more precise, Data analysis converts raw data into meaningful insights and valuable information which helps in making informed decisions in various fields like healthcare, education, business, etc.
Why Data Analysis is Important?
Below is the list of reasons why is data analysis crucial today −
Accurate Data − We need data analysis that helps businesses acquire relevant and accurate information that they can use to plan business strategies and make informed decisions related to future plans and realign the companys vision and goal.
Better decision-making − Data analysis helps in making informed decisions by identifying patterns and trends in the data and providing valuable insights. This enables businesses and organizations to make data-driven decisions, which can lead to better outcomes and increased success.
Improved Efficiency − Analyzing data can help identify inefficiencies and areas for improvement in business operations, leading to better resource allocation and increased efficiency.
Competitive Advantage − By analyzing data, businesses can gain a competitive advantage by identifying new opportunities, developing new products or services, and improving customer satisfaction.
Risk Management − Analyzing data can help identify potential risks and threats to a business, enabling proactive measures to be taken to mitigate those risks.
Customer insights − Data analysis can provide valuable insights into customer behavior and preferences, enabling businesses to tailor their products and services to better meet customer needs.
Data Analysis Process
As the complexity and quantity of data accessible to business grows the complexity, so does the need for data analysis increases for cleaning the data and to extract relevant information that can be used by the businesses to make informed decisions.
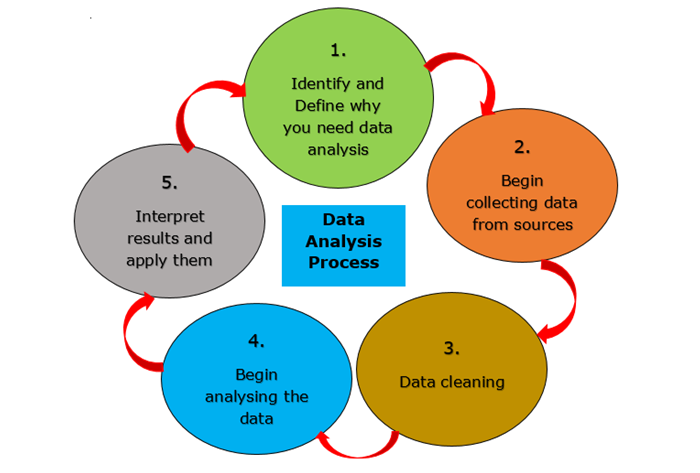
Typically, the data analysis process involves many iterative rounds. Let's examine each in more detail.
Identify − Determine the business issue you want to address. What issue is the firm attempting to address? What must be measured, and how will it be measured?
Collect − Get the raw data sets necessary to solve the indicated query. Internal sources, such as client relationship management (CRM) software, or secondary sources, such as government records or social media application programming interfaces, may be used to gather data (APIs).
Clean − Prepare the data for analysis by cleansing it. This often entails removing duplicate and anomalous data, resolving inconsistencies, standardizing data structure and format, and addressing white spaces and other grammatical problems.
Analyze the Data − You may begin to identify patterns, correlations, outliers, and variations that tell a narrative by transforming the data using different data analysis methods and tools. At this phase, you may utilize data mining to identify trends within databases or data visualization tools to convert data into an easily digestible graphical format.
Interpret − Determine how effectively the findings of your analysis addressed your initial query by interpreting them. Based on the facts, what suggestions are possible? What constraints do your conclusions have?
Types of Data Analysis
Data may be utilized to answer questions and assist decision making in several ways. To choose the optimal method for analyzing your data, you must have knowledge about the four types of data analysis widely used in the area might be helpful.
We will discuss each one in detail in the below sections −
Descriptive Analysis
Descriptive analytics is the process of looking at both current and past data to find patterns and trends. It's sometimes called the simplest way to look at data because it shows about trends and relationships without going into more detail.
Descriptive analytics is easy to use and is probably something almost every company does every day. Simple statistical software like Microsoft Excel or data visualisation tools like Google Charts and Tableau can help separate data, find trends and relationships between variables, and show information visually.
Descriptive analytics is a good way to show how things have changed over time. It also uses trends as a starting point for more analysis to help make decisions.
This type of analysis answers the question, What happened?.
Some examples of descriptive analysis are financial statement analysis, survey reports.
Diagnostic Analysis
Diagnostic analytics is the process of using data to figure out why trends and correlation between variables happen. It is the next step following identifying trends using descriptive analytics. You can do diagnostic analysis manually, with an algorithm, or with statistical software (such as Microsoft Excel).
Before getting into diagnostic analytics, you should know how to test a hypothesis, what the difference is between correlation and causation, and what diagnostic regression analysis is.
This type of analysis answers the question, Why did this happened?.
Some examples of diagnostic analysis are examining market demand, explaining customer behavior.
Predictive Analysis
Predictive analytics is the process of using data to try to figure out what will happen in the future. It uses data from the past to make predictions about possible future situations that can help make strategic decisions.
The forecasts might be for the near term or future, such as anticipating the failure of a piece of equipment later that day, or for the far future, such as projecting your company's cash flows for the next year.
Predictive analysis can be done manually or with the help of algorithms for machine learning. In either case, data from the past is used to make guesses or predictions about what will happen in the future.
Regression analysis, which may detect the connection between two variables (linear regression) or three or more variables, is one predictive analytics method (multiple regression). The connections between variables are expressed in a mathematical equation that may be used to anticipate the result if one variable changes.
Regression allows us to gain insights into the structure of that relationship and provides measures of how well the data fit that relationship. Such insights can be extremely useful for assessing past patterns and formulating predictions. Forecasting can help us to build data-driven plans and make more informed decisions.
This type of analysis answers the question, What might happen in the future?.
Some examples of predictive analysis are Marketing-behavioral targeting, Healthcare-early detection of a disease or an allergic reaction.
Prescriptive Analysis
Prescriptive analytics is the process of using data to figure out the best thing to do next. This type of analysis looks at all the important factors and comes up with suggestions for what to do next. This makes prescriptive analytics a useful tool for making decisions based on data.
In prescriptive analytics, machine-learning algorithms are often used to sort through large amounts of data faster and often more efficiently than a person can. Using "if" and "else" statements, algorithms sort through data and make suggestions based on a certain set of requirements. For example, if at least 50% of customers in a dataset said they were "very unsatisfied" with your customer service team, the algorithm might suggest that your team needs more training.
It's important to remember that algorithms can make suggestions based on data, but they can't replace human judgement. Prescriptive analytics is a tool that should be used as such to help make decisions and come up with strategies. Your judgement is important and needed to give context and limits to what an algorithm comes up with.
This type of analysis answers the question, What should we do next?.
Some examples of prescriptive analysis are: Investment decisions, Sales: Lead scoring.
