- D3.js - Home
- D3.js - Introduction
- D3.js - Installation
- D3.js - Concepts
- D3.js - Selections
- D3.js - Data Join
- D3.js - Introduction to SVG
- D3.js - SVG Transformation
- D3.js - Transition
- D3.js - Animation
- D3.js - Drawing Charts
- D3.js - Graphs
- D3.js - Geographies
- D3.js - Array API
- D3.js - Collections API
- D3.js - Selection API
- D3.js - Paths API
- D3.js - Scales API
- D3.js - Axis API
- D3.js - Shapes API
- D3.js - Colors API
- D3.js - Transitions API
- D3.js - Dragging API
- D3.js - Zooming API
- D3.js - Requests API
- Delimiter-Separated Values API
- D3.js - Timer API
- D3.js - Working Example
D3.js - Quick Guide
D3.js - Introduction
Data visualization is the presentation of data in a pictorial or graphical format. The primary goal of data visualization is to communicate information clearly and efficiently via statistical graphics, plots and information graphics.
Data visualization helps us to communicate our insights quickly and effectively. Any type of data, which is represented by a visualization allows users to compare the data, generate analytic reports, understand patterns and thus helps them to take the decision. Data visualizations can be interactive, so that users analyze specific data in the chart. Well, Data visualizations can be developed and integrated in regular websites and even mobile applications using different JavaScript frameworks.
What is D3.js?
D3.js is a JavaScript library used to create interactive visualizations in the browser. The D3.js library allows us to manipulate elements of a webpage in the context of a data set. These elements can be HTML, SVG, or Canvas elements and can be introduced, removed, or edited according to the contents of the data set. It is a library for manipulating the DOM objects. D3.js can be a valuable aid in data exploration, it gives you control over your data's representation and lets you add interactivity.
Why Do We Need D3.js?
D3.js is one of the premier framework when compare to other libraries. This is because it works on the web and its data visualizations are par excellence. Another reason it has worked so well is owing to its flexibility. Since it works seamlessly with the existing web technologies and can manipulate any part of the document object model, it is as flexible as the Client Side Web Technology Stack (HTML, CSS, and SVG). It has a great community support and is easier to learn.
D3.js Features
D3.js is one of the best data visualization framework and it can be used to generate simple as well as complex visualizations along with user interaction and transition effects. Some of its salient features are listed below −
- Extremely flexible.
- Easy to use and fast.
- Supports large datasets.
- Declarative programming.
- Code reusability.
- Has wide variety of curve generating functions.
- Associates data to an element or group of elements in the html page.
D3.js Benefits
D3.js is an open source project and works without any plugin. It requires very less code and comes up with the following benefits −
Great data visualization.
It is modular. You can download a small piece of D3.js, which you want to use. No need to load the whole library every time.
Easy to build a charting component.
DOM manipulation.
In the next chapter, we will understand how to install D3.js on our system.
D3.js - Installation
In this chapter, we will learn how to set up the D3.js development environment. Before we start, we need the following components −
- D3.js library
- Editor
- Web browser
- Web server
Let us go through the steps one by one in detail.
D3.js Library
We need to include the D3.js library into your HTML webpage in order to use D3.js to create data visualization. We can do it in the following two ways −
- Include the D3.js library from your project's folder.
- Include D3.js library from CDN (Content Delivery Network).
Download D3.js Library
D3.js is an open-source library and the source code of the library is freely available on the web at https://d3js.org/ website. Visit the D3.js website and download the latest version of D3.js (d3.zip). As of now, the latest version is 4.6.0.
After the download is complete, unzip the file and look for d3.min.js. This is the minified version of the D3.js source code. Copy the d3.min.js file and paste it into your project's root folder or any other folder, where you want to keep all the library files. Include the d3.min.js file in your HTML page as shown below.
Example − Let us consider the following example.
<!DOCTYPE html>
<html lang = "en">
   <head>
      <script src = "/path/to/d3.min.js"></script>
   </head>

   <body>
      <script>
         // write your d3 code here..
      </script>
   </body>
</html>
D3.js is a JavaScript code, so we should write all our D3 code within script tag. We may need to manipulate the existing DOM elements, so it is advisable to write the D3 code just before the end of the body tag.
Include D3 Library from CDN
We can use the D3.js library by linking it directly into our HTML page from the Content Delivery Network (CDN). CDN is a network of servers where files are hosted and are delivered to a user based on their geographic location. If we use the CDN, we do not need to download the source code.
Include the D3.js library using the CDN URL https://d3js.org/d3.v4.min.js into our page as shown below.
Example − Let us consider the following example.
<!DOCTYPE html>
<html lang = "en">
   <head>
      <script src = "https://d3js.org/d3.v4.min.js"></script>
   </head>

   <body>
      <script>
         // write your d3 code here..
      </script>
   </body>
</html>
D3.js Editor
We will need an editor to start writing your code. There are some great IDEs (Integrated Development Environment) with support for JavaScript like −
- Visual Studio Code
- WebStorm
- Eclipse
- Sublime Text
These IDEs provide intelligent code completion as well as support some of the modern JavaScript frameworks. If you do not have fancy IDE, you can always use a basic editor like Notepad, VI, etc.
Web Browser
D3.js works on all the browsers except IE8 and lower.
Web Server
Most browsers serve local HTML files directly from the local file system. However, there are certain restrictions when it comes to loading external data files. In the latter chapters of this tutorial, we will be loading data from external files like CSV and JSON. Therefore, it will be easier for us, if we set up the web server right from the beginning.
You can use any web server, which you are comfortable with − e.g. IIS, Apache, etc.
Viewing Your Page
In most cases, we can just open your HTML file in a web browser to view it. However, when loading external data sources, it is more reliable to run a local web server and view your page from the server (http://localhost:8080).
D3.js - Concepts
D3.js is an open source JavaScript library for −
- Data-driven manipulation of the Document Object Model (DOM).
- Working with data and shapes.
- Laying out visual elements for linear, hierarchical, network and geographic data.
- Enabling smooth transitions between user interface (UI) states.
- Enabling effective user interaction.
Web Standards
Before we can start using D3.js to create visualizations, we need to get familiar with web standards. The following web standards are heavily used in D3.js.
- HyperText Markup Language (HTML)
- Document Object Model (DOM)
- Cascading Style Sheets (CSS)
- Scalable Vector Graphics (SVG)
- JavaScript
Let us go through each of these web standards one by one in detail.
HyperText Markup Language (HTML)
As we know, HTML is used to structure the content of the webpage. It is stored in a text file with the extension .html.
Example − A typical bare-bones HTML example looks like this
<!DOCTYPE html>
<html lang = "en">
   <head>
      <meta charset = "UTF-8">
      <title></title>
   </head>

   <body>
   </body>
</html>
Document Object Model (DOM)
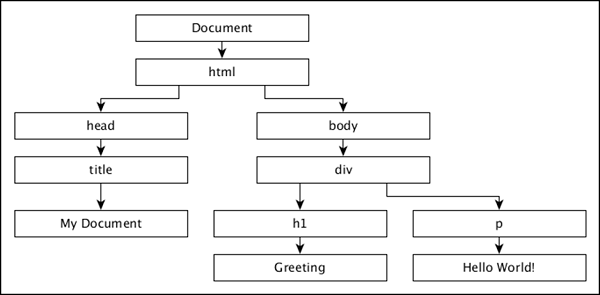
When a HTML page is loaded by a browser, it is converted to a hierarchical structure. Every tag in HTML is converted to an element / object in the DOM with a parent-child hierarchy. It makes our HTML more logically structured. Once the DOM is formed, it becomes easier to manipulate (add/modify/remove) the elements on the page.
Let us understand the DOM using the following HTML document −
<!DOCTYPE html>
<html lang = "en">
   <head>
      <title>My Document</title>
   </head>

   <body>
      <div>
         <h1>Greeting</h1>
         <p>Hello World!</p>
      </div>
   </body>
</html>
The document object model of the above HTML document is as follows,
Cascading Style Sheets (CSS)
While HTML gives a structure to the webpage, CSS styles makes the webpage more pleasant to look at. CSS is a Style Sheet Language used to describe the presentation of a document written in HTML or XML (including XML dialects like SVG or XHTML). CSS describes how elements should be rendered on a webpage.
Scalable Vector Graphics (SVG)
SVG is a way to render images on the webpage. SVG is not a direct image, but is just a way to create images using text. As its name suggests, it is a Scalable Vector. It scales itself according to the size of the browser, so resizing your browser will not distort the image. All browsers support SVG except IE 8 and below. Data visualizations are visual representations and it is convenient to use SVG to render visualizations using the D3.js.
Think of SVG as a canvas on which we can paint different shapes. So to start with, let us create an SVG tag −
<svg width = "500" height = "500"></<svg>
The default measurement for SVG is pixels, so we do not need to specify if our unit is pixel. Now, if we want to draw a rectangle, we can draw it using the code below −
<svg width = "500" height = "500">
   <rect x = "0" y = "0" width = "300" height = "200"></rect>
</svg>
We can draw other shapes in SVG such as − Line, Circle, Ellipse, Text and Path.
Just like styling HTML elements, styling SVG elements is simple. Let us set the background color of the rectangle to yellow. For that, we need to add an attribute fill and specify the value as yellow as shown below −
<svg width = "500" height = "500">
   <rect x = "0" y = "0" width = "300" height = "200" fill = "yellow"></rect>
</svg>
JavaScript
JavaScript is a loosely typed client side scripting language that executes in the user's browser. JavaScript interacts with HTML elements (DOM elements) in order to make the web user interface interactive. JavaScript implements the ECMAScript Standards, which includes core features based on ECMA-262 specifications as well as other features, which are not based on the ECMAScript standards. JavaScript knowledge is a prerequisite for D3.js.
D3.js - Selections
Selections is one of the core concepts in D3.js. It is based on CSS selectors. It allows us to select one or more elements in a webpage. In addition, it allows us to modify, append, or remove elements in a relation to the pre-defined dataset. In this chapter, we will see how to use selections to create data visualizations.
D3.js helps to select elements from the HTML page using the following two methods −
select() − Selects only one DOM element by matching the given CSS selector. If there are more than one elements for the given CSS selector, it selects the first one only.
selectAll() − Selects all DOM elements by matching the given CSS selector. If you are familiar with selecting elements with jQuery, D3.js selectors are almost the same.
Let us go through each of the methods in detail.
The select() method
The select() method selects the HTML element based on CSS Selectors. In CSS Selectors, you can define and access HTML-elements in the following three ways −
- Tag of a HTML element (e.g. div, h1, p, span, etc.,)
- Class name of a HTML element
- ID of a HTML element
Let us see it in action with examples.
Selection by Tag
You can select HTML elements using its TAG. The following syntax is used to select the div tag elements,
d3.select(div)
Example − Create a page select_by_tag.html and add the following changes,
<!DOCTYPE html>
<html>
   <head>
      <script type = "text/javascript" src = "https://d3js.org/d3.v4.min.js"></script>
   </head>

   <body>
      <div>
         Hello World!
      </div>

      <script>
         d3.select("div").text();
      </script>
   </body>
</html>
By requesting the webpage through the browser, you will see the following output on the screen −
Selection by Class name
HTML elements styled using CSS classes can be selected by using the following syntax.
d3.select(.<class name>)
Create a webpage select_by_class.html and add the following changes −
<!DOCTYPE html>
<html>
   <head>
      <script type = "text/javascript" src = "https://d3js.org/d3.v4.min.js"></script>
   </head>

   <body>
      <div class = "myclass">
         Hello World!
      </div>

      <script>
         ad3.select(".myclass").text();
      </script>
   </body>
</html>
By requesting the webpage through the browser, you will see the following output on the screen −
Selection by ID
Every element in a HTML page should have a unique ID. We can use this unique ID of an element to access it using the select() method as specified below.
d3.select(#<id of an element>)
Create a webpage select_by_id.html and add the following changes.
<!DOCTYPE html>
<html>
   <head>
      <script type = "text/javascript" src = "https://d3js.org/d3.v4.min.js"></script>
   </head>

   <body>
      <div id = "hello">
         Hello World!
      </div>

      <script>
         d3.select("#hello").text();
      </script>
   </body>
</html>
By requesting the webpage through the browser, you will see the following output on the screen.
Adding DOM Elements
The D3.js selection provides the append() and the text() methods to append new elements into the existing HTML documents. This section explains about adding DOM elements in detail.
The append() Method
The append() method appends a new element as the last child of the element in the current selection. This method can also modify the style of the elements, their attributes, properties, HTML and text content.
Create a webpage select_and_append.html and add the following changes −
<!DOCTYPE html>
<html>
   <head>
      <script type = "text/javascript" src = "https://d3js.org/d3.v4.min.js"></script>
   </head>

   <body>
      <div class = "myclass">
         Hello World!
      </div>

      <script>
         d3.select("div.myclass").append("span");
      </script>
   </body>
</html>
Requesting the webpage through browser, you could see the following output on the screen,
Here, the append() method adds a new tag span inside the div tag as shown below −
<div class = "myclass">
   Hello World!<span></span>
</div>
The text() Method
The text() method is used to set the content of the selected / appended elements. Let us change the above example and add the text() method as shown below.
<!DOCTYPE html>
<html>
   <head>
      <script type = "text/javascript" src = "https://d3js.org/d3.v4.min.js"></script>
   </head>

   <body>
      <div class = "myclass">
         Hello World!
      </div>

      <script>
         d3.select("div.myclass").append("span").text("from D3.js");
      </script>
   </body>
</html>
Now refresh the webpage and you will see the following response.
Here, the above script performs a chaining operation. D3.js smartly employs a technique called the chain syntax, which you may recognize from jQuery. By chaining methods together with periods, you can perform several actions in a single line of code. It is fast and easy. The same script can also access without chain syntax as shown below.
var body = d3.select("div.myclass");
var span = body.append("span");
span.text("from D3.js");
Modifying Elements
D3.js provides various methods, html(), attr() and style() to modify the content and style of the selected elements. Let us see how to use modify methods in this chapter.
The html() Method
The html() method is used to set the html content of the selected / appended elements.
Create a webpage select_and_add_html.html and add the following code.
<!DOCTYPE html>
<html>
   <head>
      <script type = "text/javascript" src = "https://d3js.org/d3.v4.min.js"></script>
   </head>

   <body>
      <div class = "myclass">
         Hello World!
      </div>

      <script>
         d3.select(".myclass").html("Hello World! <span>from D3.js</span>");
      </script>
   </body>
</html>
By requesting the webpage through the browser, you will see the following output on the screen.
The attr() Method
The attr() method is used to add or update the attribute of the selected elements. Create a webpage select_and_modify.html and add the following code.
<!DOCTYPE html>
<html>
   <head>
      <script type = "text/javascript" src = "https://d3js.org/d3.v4.min.js"></script>
   </head>

   <body>
      <div class = "myclass">
         Hello World!
      </div>

      <script>
         d3.select(".myclass").attr("style", "color: red");
      </script>
   </body>
</html>
By requesting the webpage through the browser, you will see the following output on the screen.
The style() Method
The style() method is used to set the style property of the selected elements. Create a webpage select_and_style.html and add the following code.
<!DOCTYPE html>
<html>
   <head>
      <script type = "text/javascript" src = "https://d3js.org/d3.v4.min.js"></script>
   </head>

   <body>
      <div class = "myclass">
         Hello World!
      </div>

      <script>
         d3.select(".myclass").style("color", "red");
      </script>
   </body>
</html>
By requesting the webpage through the browser, you will see the following output on the screen.
The classed() Method
The classed() method is exclusively used to set the class attribute of an HTML element. Since, a single HTML element can have multiple classes; we need to be careful while assigning a class to an HTML element. This method knows how to handle one or many classes on an element, and it will be performant.
Add class − To add a class, the second parameter of the classed method must be set to true. It is defined below −
d3.select(".myclass").classed("myanotherclass", true);
Remove class − To remove a class, the second parameter of the classed method must be set to false. It is defined below −
d3.select(".myclass").classed("myanotherclass", false);
Check class − To check for the existence of a class, just leave off the second parameter and pass the class name you are querying. This will return true, if it exists, false, if it does not.
d3.select(".myclass").classed("myanotherclass");
This will return true, if any element in the selection has the class. Use d3.select for single element selection.
Toggle class − To flip a class to the opposite state remove it if it exists already, add it if it does not yet exist you can do one of the following.
For a single element, the code might look as shown below −
var element = d3.select(".myclass")
element.classed("myanotherclass", !oneBar.classed("myanotherclass"));
The selectAll() Method
The selectAll() method is used to select multiple elements in the HTML document. The select method selects the first element, but the selectAll method selects all the elements that match the specific selector string. In case the selection matches none, then it returns an empty selection. We can chain all the appending modifying methods, append(), html(), text(), attr(), style(), classed(), etc., in the selectAll() method as well. In this case, the methods will affect all the matching elements. Let us understand by creating a new webpage select_multiple.html and add the following script −
<!DOCTYPE html>
<html>
   <head>
      <script type = "text/javascript" src = "https://d3js.org/d3.v4.min.js"></script>
   </head>

   <body>
      <h2 class = "myclass">Message</h2>
      <div class = "myclass">
         Hello World!
      </div>

      <script>
         d3.selectAll(".myclass").attr("style", "color: red");
      </script>
   </body>
</html>
By requesting the webpage through the browser, you will see the following output on the screen.
Here, the attr() method applies to both div and h2 tag and the color of the text in both tags changes to Red.
D3.js - Data Join
Data join is another important concept in D3.js. It works along with selections and enables us to manipulate the HTML document with respect to our data set (a series of numerical values). By default, D3.js gives data set the highest priority in its methods and each item in the data set corresponds to a HTML element. This chapter explains data joins in detail.
What is a Data Join?
Data join enables us to inject, modify and remove elements (HTML element as well as embedded SVG elements) based on the data set in the existing HTML document. By default, each data item in the data set corresponds to an element (graphical) in the document.
As the data set changes, the corresponding element can also be manipulated easily. Data join creates a close relationship between our data and graphical elements of the document. Data join makes manipulation of the elements based on the data set a very simple and easy process.
How Data Join Works?
The primary purpose of the Data join is to map the elements of the existing document with the given data set. It creates a virtual representation of the document with respect to the given data set and provides methods to work with the virtual representation. Let us consider a simple data set as shown below.
[10, 20, 30, 25, 15]
The data set has five items and so, it can be mapped to five elements of the document. Let us map it to the li element of the following document using the selector's selectAll() method and data join's data() method.
HTML
<ul id = "list">
   <li><li>
   <li></li>
</ul>
D3.js code
d3.select("#list").selectAll("li").data([10, 20, 30, 25, 15]);
Now, there are five virtual elements in the document. The first two virtual elements are the two li element defined in the document as shown below.
1. li - 10
2. li - 20
We can use all the selector's element modifying methods like attr(), style(), text(), etc., for the first two li as shown below.
d3.select("#list").selectAll("li")
   .data([10, 20, 30, 25, 15])
   .text(function(d) { return d; });
The function in the text() method is used to get the li elements mapped data. Here, d represent 10 for first li element and 20 for second li element.
The next three elements can be mapped to any elements and it can be done using the data join's enter() and selector's append() method. The enter() method gives access to the remaining data (which is not mapped to the existing elements) and the append() method is used to create a new element from the corresponding data. Let us create li for the remaining data items as well. The data map is as follows −
3. li - 30
4. li - 25
5. li - 15
The code to create new a li element is as follows −
d3.select("#list").selectAll("li")
   .data([10, 20, 30, 25, 15])
   .text(function(d) { return "This is pre-existing element and the value is " + d; })
   .enter()
   .append("li")
   .text(function(d)
      { return "This is dynamically created element and the value is " + d; });
Data join provides another method called as the exit() method to process the data items removed dynamically from the data set as shown below.
d3.selectAll("li")
   .data([10, 20, 30, 15])
   .exit()
   .remove()
Here, we have removed the fourth item from the data set and its corresponding li using the exit() and the remove() methods.
The complete code is as follows −
<!DOCTYPE html>
<html>
   <head>
      <script type = "text/javascript" src = "https://d3js.org/d3.v4.min.js"></script>
      <style>
         body { font-family: Arial; }
      </style>
   </head>

   <body>
      <ul id = "list">
         <li></li>
         <li></li>
      </ul>

      <input type = "button" name = "remove" value = "Remove fourth value"
         onclick = "javascript:remove()" />

      <script>
         d3.select("#list").selectAll("li")
            .data([10, 20, 30, 25, 15])
            .text(function(d)
               { return "This is pre-existing element and the value is " + d; })
            .enter()
            .append("li")
            .text(function(d)
               { return "This is dynamically created element and the value is " + d; });

         function remove() {
            d3.selectAll("li")
            .data([10, 20, 30, 15])
            .exit()
            .remove()
         }
      </script>
   </body>
</html>
The result of the above code will be as follows −
Data Join Methods
Data join provides the following four methods to work with data set −
- datum()
- data()
- enter()
- exit()
Let us go through each of these methods in detail.
The datum() Method
The datum() method is used to set value for a single element in the HTML document. It is used once the element is selected using selectors. For example, we can select an existing element (p tag) using the select() method and then, set data using the datum() method. Once data is set, we can either change the text of the selected element or add new element and assign the text using the data set by datum() method.
Create a page datajoin_datum.html and add the following code −
<!DOCTYPE html>
<html>
   <head>
      <script type = "text/javascript" src = "https://d3js.org/d3.v4.min.js"></script>
   </head>

   <body>
      <p></p>
      <div></div>
      <script>
         d3.select("p")
         .datum(50)
         .text(function(d) {
            return "Used existing paragraph element and the data " + d + " is assigned.";
         });

         d3.select("div")
         .datum(100)
         .append("p")
         .text(function(d) {
            return "Created new paragraph element and the data " + d + " is assigned.";
         });
      </script>
   </body>
</html>
The output of the above code will be as follows.
The data() method
The data() method is used to assign a data set to a collection of elements in a HTML document. It is used once the HTML elements are selected using selectors. In our list example, we have used it to set the data set for the li selector.
d3.select("#list").selectAll("li")
   .data([10, 20, 30, 25, 15]);
The enter() method
The enter() method outputs the set of data item for which no graphic element existed before. In our list example, we have used it to create new li elements.
d3.select("#list").selectAll("li")
   .data([10, 20, 30, 25, 15])
   .text(function(d) { return "This is pre-existing element and the value is " + d; })
   .enter()
   .append("li")
   .text(function(d) { return "This is dynamically created element and the value is " + d; });
The exit() method
The exit() method outputs the set of graphic elements for which no data exists any longer. In our list example, we have used it to remove one of the li element dynamically by removing the data item in the data set.
function remove() {
   d3.selectAll("li")
      .data([10, 20, 30, 15])
      .exit()
      .remove()
}
Data Function
In the DOM manipulation chapter, we learned about different DOM manipulation methods in D3.js such as style(), text(), etc. Each of these functions normally takes a constant value as its parameter. Nevertheless, in the context of Data join, it takes an anonymous function as a parameter. This anonymous function takes the corresponding data and the index of the data set assigned using the data() method. So, this anonymous function will be called for each of our data values bound to the DOM. Consider the following text() function.
.text(function(d, i) {
   return d;
});
Within this function, we can apply any logic to manipulate the data. These are anonymous functions, meaning that there is no name associated with the function. Other than the data (d) and index (i) parameter, we can access the current object using this keyword as shown below −
.text(function (d, i) {
   console.log(d); // the data element
   console.log(i); // the index element
   console.log(this); // the current DOM object
   return d;
});
Consider the following example.
<!DOCTYPE html>
<html>
   <head>
      <script type = "text/javascript" src = "https://d3js.org/d3.v4.min.js"></script>
      <style>
         body { font-family: Arial; }
      </style>
   </head>

   <body>
      <p></p>
      <p></p>
      <p></p>
      <script>
         var data = [1, 2, 3];
         var paragraph = d3.select("body")
         .selectAll("p")
         .data(data)
         .text(function (d, i) {
            console.log("d: " + d);
            console.log("i: " + i);
            console.log("this: " + this);
            return "The index is " + i + " and the data is " + d;
         });
      </script>
   </body>
</html>
The above script will generate the following result −
In the above example, the parameter d gives you your data element, i gives you the index of data in the array and this is a reference of the current DOM element. In this case, it is the paragraph element. Notice that we have called .data(data) function above. The data() function provides data to the selected elements, in our case it is data array.
D3.js - Introduction to SVG
SVG stands for Scalable Vector Graphics. SVG is an XML-based vector graphics format. It provides options to draw different shapes such as Lines, Rectangles, Circles, Ellipses, etc. Hence, designing visualizations with SVG gives you more power and flexibility.
Features of SVG
Some of the salient features of SVG are as follows −
- SVG is a vector based image format and it is text-based.
- SVG is similar in structure to HTML.
- SVG can be represented as a Document object model.
- SVG properties can be specified as attributes.
- SVG should have absolute positions relative to the origin (0, 0).
- SVG can be included as is in the HTML document.
A Minimal Example
Let us create a minimal SVG image and include it in the HTML document.
Step 1 − Create a SVG image and set width as 300 pixel and height as 300 pixel.
<svg width = "300" height = "300">

</svg>
Here, the svg tag starts an SVG image and it has width and height as attributes. The default unit of the SVG format is pixel.
Step 2 − Create a line starting at (100, 100) and ending at (200, 100) and set red color for the line.
<line x1 = "100" y1 = "100" x2 = "200" y2 = "200"
   style = "stroke:rgb(255,0,0);stroke-width:2"/>
Here, the line tag draws a line and its attributes x1, y1 refers to the starting point and x2, y2 refers to the ending point. The style attribute sets color and thickness of the line using the stroke and the stroke-width styles.
x1 − This is the x-coordinate of the first point.
y1 − This is the y-coordinate of the first point.
x2 − This is the x-coordinate of the second point.
y2 − This is the y-coordinate of the second point.
stroke − Color of the line.
stroke-width − Thickness of the line.
Step 3 − Create a HTML document, svg_line.html and integrate the above SVG as shown below −
<!DOCTYPE html>
<html>
   <head>
      <script type = "text/javascript" src = "https://d3js.org/d3.v4.min.js"></script>
      <style>
         body { font-family: Arial; }
      </style>
   </head>

   <body>
      <div id = "svgcontainer">
         <svg width = "300" height = "300">
            <line x1 = "100" y1 = "100"
               x2 = "200" y2 = "200" style = "stroke:rgb(255,0,0);
               stroke-width:2"/>
         </svg>
      </div>
      <p></p>
      <p></p>
   </body>
</html>
The above program will yield the following result.
SVG Using D3.js
To create SVG using D3.js, let us follow the steps given below.
Step 1 − Create a container to hold the SVG image as given below.
<div id = "svgcontainer"></div>
Step 2 − Select the SVG container using the select() method and inject the SVG element using the append() method. Add the attributes and styles using the attr() and the style() methods.
var width = 300;
var height = 300;
var svg = d3.select("#svgcontainer")
   .append("svg").attr("width", width).attr("height", height);
Step 3 − Similarly, add the line element inside the svg element as shown below.
svg.append("line")
   .attr("x1", 100)
   .attr("y1", 100)
   .attr("x2", 200)
   .attr("y2", 200)
   .style("stroke", "rgb(255,0,0)")
   .style("stroke-width", 2);
The complete code is as follows −
<!DOCTYPE html>
<html>
   <head>
      <script type = "text/javascript" src = "https://d3js.org/d3.v4.min.js"></script>
      <style>
         body { font-family: Arial; }
      </style>
   </head>

   <body>
      <div id = "svgcontainer">
      </div>
      <script language = "javascript">
         var width = 300;
         var height = 300;
         var svg = d3.select("#svgcontainer")
            .append("svg")
            .attr("width", width)
            .attr("height", height);
         svg.append("line")
            .attr("x1", 100)
            .attr("y1", 100)
            .attr("x2", 200)
            .attr("y2", 200)
            .style("stroke", "rgb(255,0,0)")
            .style("stroke-width", 2);
      </script>
   </body>
</html>
The above code yields the following result.
Rectangle Element
A rectangle is represented by the <rect> tag as shown below.
<rect x = "20" y = "20" width = "300" height = "300"></rect>
The attributes of a rectangle are as follows −
x − This is the x-coordinate of the top-left corner of the rectangle.
y − This is the y-coordinate of the top-left corner of the rectangle.
width − This denotes the width of the rectangle.
height − This denotes the height of the rectangle.
A simple rectangle in SVG is defined as explained below.
<svg width = "300" height = "300">
   <rect x = "20" y = "20" width = "300" height = "300" fill = "green"></rect>
</svg>
The same rectangle can be created dynamically as described below.
<!DOCTYPE html>
<html>
   <head>
      <script type = "text/javascript" src = "https://d3js.org/d3.v4.min.js"></script>
   </head>

   <body>
      <div id = "svgcontainer"></div>
      <script>
         var width = 300;
         var height = 300;
         //Create SVG element
         var svg = d3.select("#svgcontainer")
            .append("svg")
            .attr("width", width)
            .attr("height", height);
         //Create and append rectangle element
         svg.append("rect")
            .attr("x", 20)
            .attr("y", 20)
            .attr("width", 200)
            .attr("height", 100)
            .attr("fill", "green");
      </script>
   </body>
</html>
The above code will yield the following result.
Circle Element
A circle is represented by the <circle> tag as explained below.
<circle cx = "200" cy = "50" r = "20"/>
The attributes of circle are as follows −
cx − This is the x-coordinate of the center of the circle.
cy − This is the y-coordinate of the center of the circle.
r − This denotes the radius of the circle.
A simple circle in SVG is described below.
<svg width = "300" height = "300">
   <circle cx = "200" cy = "50" r = "20" fill = "green"/>
</svg>
The same circle can be created dynamically as described below.
<!DOCTYPE html>
<html>
   <head>
      <script type = "text/javascript" src = "https://d3js.org/d3.v4.min.js"></script>
   </head>

   <body>
      <div id = "svgcontainer"></div>
      <script>
         var width = 300;
         var height = 300;
         //Create SVG element
         var svg = d3.select("#svgcontainer")
            .append("svg")
            .attr("width", width)
            .attr("height", height);
         //Append circle
         svg.append("circle")
            .attr("cx", 200)
            .attr("cy", 50)
            .attr("r", 20)
            .attr("fill", "green");
      </script>
   </body>
</html>
The above code will yield the following result.
Ellipse Element
The SVG Ellipse element is represented by the <ellipse> tag as explained below.
<ellipse cx = "200" cy = "50" rx = "100" ry = "50"/>
The attributes of an ellipse are as follows −
cx − This is the x-coordinate of the center of the ellipse.
cy − This is the y-coordinate of the center of the ellipse.
rx − This is the x radius of the circle.
ry − This is the y radius of the circle.
A simple ellipse in the SVG is described below.
<svg width = "300" height = "300">
   <ellipse cx = "200" cy = "50" rx = "100" ry = "50" fill = "green" />
</svg>
The same ellipse can be created dynamically as below,
<html>
   <head>
      <script type = "text/javascript" src = "https://d3js.org/d3.v4.min.js"></script>
   </head>

   <body>
      <div id = "svgcontainer"></div>
      <script>
         var width = 300;
         var height = 300;
         var svg = d3.select("#svgcontainer")
            .append("svg")
            .attr("width", width)
            .attr("height", height);
         svg.append("ellipse")
            .attr("cx", 200)
            .attr("cy", 50)
            .attr("rx", 100)
            .attr("ry", 50)
            .attr("fill", "green")
      </script>
   </body>
</html>
The above code will yield the following result.
D3.js - SVG Transformation
SVG provides options to transform a single SVG shape element or group of SVG elements. SVG transform supports Translate, Scale, Rotate and Skew. Let us learn transformation in this chapter.
Introduction to SVG Transformation
SVG introduces a new attribute, transform to support transformation. The possible values are one or more of the following,
Translate − It takes two options, tx refers translation along the x-axis and ty refers to the translation along the y-axis. For Example− translate(30 30).
Rotate − It takes three options, angle refers rotation angle, cx and cy refers to the center of the rotation in the x and y axis. If cx and cy are not specified, then it defaults to the current origin of the coordinate system. For Example − rotate(60).
Scale − It takes two options, sx refers to the scaling factor along the x-axis and sy refers to the scaling factor along the y-axis. Here, sy is optional and it takes the value of sx, if it is not specified. For Example − scale(10).
Skew (SkewX and SkewY) − It takes a single option; the skew-angle refers to the angle along the x-axis for SkewX and the angle along the y-axis for SkewY. For Example − skewx(20).
An example of the SVG rectangle with translate, which is described as follows −
<html>
   <head>
      <script type = "text/javascript" src = "https://d3js.org/d3.v4.min.js"></script>
   </head>

   <body>
      <svg width = "300" height = "300">
         <rect x = "20"
            y = "20"
            width = "60"
            height = "60"
            fill = "green"
            transform = "translate(30 30)">
         </rect>
      </svg>
   </body>
</html>
The above code will yield the following result.
More than one transformation can be specified for a single SVG element using space as separation. If more than one value is specified, the transformation will be applied one by one sequentially in the order specified.
<html>
   <head>
      <script type = "text/javascript" src = "https://d3js.org/d3.v4.min.js"></script>
   </head>

   <body>
      <svg width = "300" height = "300">
         <rect x = "20"
            y = "20"
            width = "60"
            height = "60"
            fill = "green"
            transform = "translate(60 60) rotate(45)">
         </rect>
      </svg>
   </body>
</html>
The above code will yield the following result.
Transformation can be applied to the SVG group element as well. This enables to transform complex graphics defined in the SVG as described below.
<html>
   <head>
      <script type = "text/javascript" src = "https://d3js.org/d3.v4.min.js"></script>
   </head>

   <body>
      <svg width = "300" height = "300">
         <g transform = "translate(60,60) rotate(30)">
            <rect x = "20"
               y = "20"
               width = "60"
               height = "30"
               fill = "green">
            </rect>
            <circle cx = "0"
               cy = "0"
               r = "30"
               fill = "red"/>
         </g>
      </svg>
   </body>
</html>
The above code will yield the following result.
A Minimal Example
To create an SVG image, try to scale, and rotate it using transformation, let us follow the steps given below.
Step 1 − Create an SVG image and set width as 300 pixels and height as 300 pixels.
<svg width = "300" height = "300">

</svg>
Step 2 − Create an SVG group.
<svg width = "300" height = "300">
   <g>
   </g>
</svg>
Step 3 − Create a rectangle of length 60 and height 30 and fill it with green color.
<svg width = "300" height = "300">
   <g>
      <rect x = "20"
         y = "20"
         width = "60"
         height = "30"
         fill = "green">
      </rect>
   </g>
</svg>
Step 4 − Create a circle of radius 30 and fill it with red color.
<svg width = "300" height = "300">
   <g>
      <rect x = "20"
         y = "20"
         width = "60"
         height = "30"
         fill = "green">
      </rect>
      <circle cx = "0"
         cy = "0"
         r = "30"
         fill = "red"/>
   </g>
</svg>
Step 5 − Add a transform attribute and add translate and rotate as shown below.
<svg width = "300" height = "300">
   <g transform = "translate(60,60) rotate(30)">
      <rect x = "20"
         y = "20"
         width = "60"
         height = "60"
         fill = "green">
      </rect>
      <circle cx = "0"
         cy = "0"
         r = "30"
         fill = "red"/>
   </g>
</svg>
Step 6 − Create an HTML document, svg_transform_rotate_group.html and integrate the above SVG as explained below.
<!DOCTYPE html>
<html>
   <head>
      <script type = "text/javascript" src = "https://d3js.org/d3.v4.min.js"></script>
      <style>
         body { font-family: Arial; }
      </style>
   </head>

   <body>
      <div id = "svgcontainer">
         <svg width = "300" height = "300">
            <g transform = "translate(60,60) rotate(30)">
               <rect x = "20"
                  y = "20"
                  width = "60"
                  height = "60"
                  fill = "green">
               </rect>
               <circle cx = "0"
                  cy = "0"
                  r = "30"
                  fill = "red"/>
            </g>
         </svg>
      </div>
   </body>
</html>
The above code will yield the following result.
Transformation Using D3.js
To create SVG using D3.js, let us follow the steps given below.
Step 1 − Create a container to hold the SVG image as explained below.
<div id = "svgcontainer"></div>
Step 2 − Create a SVG image as explained below.
var width = 300;
var height = 300;
var svg = d3.select("#svgcontainer")
   .append("svg")
   .attr("width", width)
   .attr("height", height);
Step 3 − Create a SVG group element and set translate and rotate attributes.
var group = svg.append("g").attr("transform", "translate(60, 60) rotate(30)");
Step 4 − Create an SVG rectangle and append it inside the group.
var rect = group
   .append("rect")
   .attr("x", 20)
   .attr("y", 20)
   .attr("width", 60)
   .attr("height", 30)
   .attr("fill", "green")
Step 5 − Create an SVG circle and append it inside the group.
var circle = group
   .append("circle")
   .attr("cx", 0)
   .attr("cy", 0)
   .attr("r", 30)
   .attr("fill", "red")
The complete code is as follows −
<!DOCTYPE html>
<html lang = "en">
   <head>
      <title>SVG rectangle</title>
      <script type = "text/javascript" src = "https://d3js.org/d3.v4.min.js"></script>
      <style>
         body { font-family: Arial; }
      </style>
   </head>

   <body>
      <div id = "svgcontainer"></div>
         <script language = "javascript">
            var width = 300;
            var height = 300;
            var svg = d3.select("#svgcontainer")
               .append("svg")
               .attr("width", width)
               .attr("height", height);

            var group = svg.append("g")
               .attr("transform", "translate(60, 60) rotate(30)");

            var rect = group.append("rect")
               .attr("x", 20)
               .attr("y", 20)
               .attr("width", 60)
               .attr("height", 30)
               .attr("fill", "green")

            var circle = group
               .append("circle")
               .attr("cx", 0)
               .attr("cy", 0)
               .attr("r", 30)
               .attr("fill", "red")
         </script>
      </div>
   </body>
</html>
The above code will yield the following result.
Transform Library
D3.js provides a separate library to manage transform without manually creating the transform attributes. It provides methods to handle all type of transformation. Some of the methods are transform(), translate(), scale(), rotate(), etc. You can include d3-transform in your webpage using the following script.
<script src = "http://d3js.org/d3.v4.min.js"></script>
<script src = "d3-transform.js"></script>
In the above example, the transform code can be written as shown below −
var my_transform = d3Transform()
   .translate([60, 60])
   .rotate(30);

var group = svg
   .append("g")
   .attr("transform", my_transform);
D3.js - Transition
Transition is the process of changing from one state to another of an item. D3.js provides a transition() method to perform transition in the HTML page. Let us learn about transition in this chapter.
The transition() method
The transition() method is available for all selectors and it starts the transition process. This method supports most of the selection methods such as attr(), style(), etc. But, It does not support the append() and the data() methods, which need to be called before the transition() method. Also, it provides methods specific to transition like duration(), ease(), etc. A simple transition can be defined as follows −
d3.select("body")
   .transition()
   .style("background-color", "lightblue");
A transition can be directly created using the d3.transition() method and then used along with selectors as follows.
var t = d3.transition()
   .duration(2000);
d3.select("body")
   .transition(t)
   .style("background-color", "lightblue");
A Minimal Example
Let us now create a basic example to understand how transition works.
Create a new HTML file, transition_simple.html with the following code.
<!DOCTYPE html>
<html>
   <head>
      <script type = "text/javascript" src = "https://d3js.org/d3.v4.min.js"></script>
   </head>

   <body>
      <h3>Simple transitions</h3>
      <script>
         d3.select("body").transition().style("background-color", "lightblue");
      </script>
   </body>
</html>
Here, we have selected the body element and then started transition by calling the transition() method. Then, we have instructed to transit the background color from the current color, white to light blue.
Now, refresh the browser and on the screen, the background color changes from white to light blue. If we want to change the background color from light blue to gray, we can use the following transition −
d3.select("body").transition().style("background-color", "gray");
D3.js - Animation
D3.js supports animation through transition. We can do animation with proper use of transition. Transitions are a limited form of Key Frame Animation with only two key frames start and end. The starting key frame is typically the current state of the DOM, and the ending key frame is a set of attributes, styles and other properties you specify. Transitions are well suited for transitioning to a new view without a complicated code that depends on the starting view.
Example − Let us consider the following code in transition_color.html page.
<!DOCTYPE html>
<html>
   <head>
      <script type = "text/javascript" src = "https://d3js.org/d3.v4.min.js"></script>
   </head>

   <body>
      <h3>Simple transitions</h3>
      <script>
         d3.select("body").style("background-color", "lightblue")
         // make the background-color lightblue.transition()
         .style("background-color", "gray");
         // make the background-color gray
      </script>
   </body>
</html>
Here, the Background color of the document changed from white to light gray and then to gray.
The duration() Method
The duration() method allows property changes to occur smoothly over a specified duration rather than instantaneously. Let us make the transition which takes 5 seconds using the following code.
<!DOCTYPE html>
<html>
   <head>
      <script type = "text/javascript" src = "https://d3js.org/d3.v4.min.js"></script>
   </head>

   <body>
      <h3>Simple transitions</h3>
      <script>
         d3.selectAll("h3").transition().style("color","green").duration(5000);
      </script>
   </body>
</html>
Here, the transitions occurred smoothly and evenly. We can also assign RGB color code value directly using the following method.
d3.selectAll("h3").transition().style("color","rgb(0,150,120)").duration(5000);
Now, each color number slowly, smoothly and evenly goes from 0 to 150. To get the accurate blending of in-between frames from the start frame value to the end frame value, D3.js uses an internal interpolate method. The syntax is given below −
d3.interpolate(a, b)
D3 also supports the following interpolation types −
interpolateNumber − support numerical values.
interpolateRgb − support colors.
interpolateString − support string.
D3.js takes care of using the proper interpolate method and in advanced cases, we can use the interpolate methods directly to get our desired result. We can even create a new interpolate method, if needed.
The delay() Method
The delay() method allows a transition to take place after a certain period of time. Consider the following code in transition_delay.html.
<!DOCTYPE html>
<html>
   <head>
      <script type = "text/javascript" src = "https://d3js.org/d3.v4.min.js"></script>
   </head>

   <body>
      <h3> Simple transitions </h3>
      <script>
         d3.selectAll("h3").transition()
            .style("font-size","28px").delay(2000).duration(2000);
      </script>
   </body>
</html>
Lifecycle of Transition
Transition has a four-phased lifecycle −
- The transition is scheduled.
- The transition starts.
- The transition runs.
- The transition ends.
Let us go through each of these one by one in detail.
The Transition is scheduled
A transition is scheduled when it is created. When we call selection.transition, we are scheduling a transition. This is also when we call attr(), style() and other transition methods to define the ending key frame.
The Transition Starts
A transition starts based on its delay, which was specified when the transition was scheduled. If no delay was specified, then the transition starts as soon as possible, which is typically after a few milliseconds.
If the transition has a delay, then the starting value should be set only when the transition starts. We can do this by listening to the start event −
d3.select("body")
   .transition()
   .delay(200)
   .each("start", function() { d3.select(this).style("color", "green"); })
   .style("color", "red");
The Transition Runs
When the transition runs, it repeatedly invoked with values of transition ranging from 0 to 1. In addition to delay and duration, transitions have easing to control timing. Easing distorts time, such as for slow-in and slow-out. Some easing functions may temporarily give values of t greater than 1 or less than 0.
The Transition Ends
The transition ending time is always exactly 1, so that the ending value is set exactly when the transition ends. A transition ends based on the sum of its delay and duration. When a transition ends, the end event is dispatched.
D3.js - Drawing Charts
D3.js is used to create a static SVG chart. It helps to draw the following charts −
- Bar Chart
- Circle Chart
- Pie Chart
- Donut Chart
- Line Chart
- Bubble Chart, etc.
This chapter explains about drawing charts in D3. Let us understand each of these in detail.
Bar Chart
Bar charts are one of the most commonly used types of graph and are used to display and compare the number, frequency or other measure (e.g. mean) for different discrete categories or groups. This graph is constructed in such a way that the heights or lengths of the different bars are proportional to the size of the category they represent.
The x-axis (the horizontal axis) represents the different categories it has no scale. The y axis (the vertical axis) does have a scale and this indicates the units of measurement. The bars can be drawn either vertically or horizontally depending upon the number of categories and length or complexity of the category.
Draw a Bar Chart
Let us create a bar chart in SVG using D3. For this example, we can use the rect elements for the bars and text elements to display our data values corresponding to the bars.
To create a bar chart in SVG using D3, let us follow the steps given below.
Step 1 − Adding style in the rect element − Let us add the following style to the rect element.
svg rect {
   fill: gray;
}
Step 2 − Add styles in text element − Add the following CSS class to apply styles to text values. Add this style to SVG text element. It is defined below −
svg text {
   fill: yellow;
   font: 12px sans-serif;
   text-anchor: end;
}
Here, Fill is used to apply colors. Text-anchor is used to position the text towards the right end of the bars.
Step 3 − Define variables − Let us add the variables in the script. It is explained below.
<script>
   var data = [10, 5, 12, 15];
   var width = 300,
      scaleFactor = 20,
      barHeight = 30;
</script>
Here,
Width − Width of the SVG.
Scalefactor − Scaled to a pixel value that is visible on the screen.
Barheight − This is the static height of the horizontal bars.
Step 4 − Append SVG elements − Let us append SVG elements in D3 using the following code.
var graph = d3.select("body")
   .append("svg")
   .attr("width", width)
   .attr("height", barHeight * data.length);
Here, we will first select the document body, create a new SVG element and then append it. We will build our bar graph inside this SVG element. Then, set the width and height of SVG. Height is calculated as bar height * number of data values.
We have taken the bar height as 30 and data array length is 4. Then SVG height is calculated as barheight* datalength which is 120 px.
Step 5 − Apply transformation − Let us apply the transformation in bar using the following code.
var bar = graph.selectAll("g")
   .data(data)
   .enter()
   .append("g")
   .attr("transform", function(d, i) {
      return "translate(0," + i * barHeight + ")";
   });
Here, each bar inside corresponds with an element. Therefore, we create group elements. Each of our group elements needs to be positioned one below the other to build a horizontal bar chart. Let us take a transformation formula index * bar height.
Step 6 − Append rect elements to the bar − In the previous step, we appended group elements. Now add the rect elements to the bar using the following code.
bar.append("rect")
   .attr("width", function(d) {
      return d * scaleFactor;
   })
   .attr("height", barHeight - 1);
Here, the width is (data value * scale factor) and height is (bar height - margin).
Step 7 − Display data − This is the last step. Let us display the data on each bar using the following code.
bar.append("text")
   .attr("x", function(d) { return (d*scaleFactor); })
   .attr("y", barHeight / 2)
   .attr("dy", ".35em")
   .text(function(d) { return d; });
Here, width is defined as (data value * scalefactor). Text elements do not support padding or margin. For this reason, we need to give it a dy offset. This is used to align the text vertically.
Step 8 − Working example − The complete code listing is shown in the following code block. Create a webpage barcharts.html and add the following changes.
barcharts.html
<html>
   <head>
      <script type = "text/javascript" src = "https://d3js.org/d3.v4.min.js"></script>
      <style>
         svg rect {
            fill: gray;
         }

         svg text {
            fill: yellow;
            font: 12px sans-serif;
            text-anchor: end;
         }
      </style>
   </head>

   <body>
      <script>
         var data = [10, 5, 12, 15];

         var width = 300
            scaleFactor = 20,
            barHeight = 30;

         var graph = d3.select("body")
            .append("svg")
            .attr("width", width)
            .attr("height", barHeight * data.length);

         var bar = graph.selectAll("g")
            .data(data)
            .enter()
            .append("g")
            .attr("transform", function(d, i) {
               return "translate(0," + i * barHeight + ")";
            });
         bar.append("rect").attr("width", function(d) {
            return d * scaleFactor;
         })

         .attr("height", barHeight - 1);

         bar.append("text")
            .attr("x", function(d) { return (d*scaleFactor); })
            .attr("y", barHeight / 2)
            .attr("dy", ".35em")
            .text(function(d) { return d; });
      </script>
   </body>
</html>
Now request your browser, you will see the following response.
Circle Chart
A Circle chart is a circular statistical graphic, which is divided into slices to illustrate a numerical proportion.
Draw a Circle Chart
Let us create a circle chart in SVG using D3. To do this, we must adhere to the following steps −
Step 1 − Define variables − Let us add the variables in the script. It is shown in the code block below.
<script>
   var width = 400;
   var height = 400;
   var data = [10, 20, 30];
   var colors = ['green', 'purple', 'yellow'];
</script>
Here,
Width − width of the SVG.
Height − height of the SVG.
Data − array of data elements.
Colors − apply colors to the circle elements.
Step 2 − Append SVG elements − Let us append SVG elements in D3 using the following code.
var svg = d3.select("body")
   .append("svg")
   .attr("width", width)
   .attr("height", height);
Step 3 − Apply transformation − Let us apply the transformation in SVG using the following code.
var g = svg.selectAll("g")
   .data(data)
   .enter()
   .append("g")
   .attr("transform", function(d, i) {
      return "translate(0,0)";
   })
Here,
var g = svg.selectAll(g) − Creates group element to hold the circles.
.data(data) − Binds our data array to the group elements.
.enter() − Creates placeholders for our group elements.
.append(g) − Appends group elements to our page.
.attr("transform", function(d, i) {
   return "translate(0,0)";
})
Here, translate is used to position your elements with respect to the origin.
Step 4 − Append circle elements − Now, append circle elements to the group using the following code.
g.append("circle")
Now, add the attributes to the group using the following code.
.attr("cx", function(d, i) {
   return i*75 + 50;
})
Here, we use the x-coordinate of the center of each circle. We are multiplying the index of the circle with 75 and adding a padding of 50 between the circles.
Next, we set the y-coordinate of the center of each circle. This is used to uniform all the circles and it is defined below.
.attr("cy", function(d, i) {
   return 75;
})
Next, set the radius of each circle. It is defined below,
.attr("r", function(d) {
   return d*1.5;
})
Here, the radius is multiplied with data value along with a constant 1.5 to increase the circle's size. Finally, fill colors for each circle using the following code.
.attr("fill", function(d, i){
   return colors[i];
})
Step 5 − Display data − This is the last step. Let us display the data on each circle using the following code.
g.append("text")
   .attr("x", function(d, i) {
      return i * 75 + 25;
   })
   .attr("y", 80)
   .attr("stroke", "teal")
   .attr("font-size", "10px")
   .attr("font-family", "sans-serif")
   .text(function(d) {
      return d;
   });
Step 6 − Working Example − The complete code listing is shown in the following code block. Create a webpage circlecharts.html and add the following changes in it.
circlecharts.html
<html>
   <head>
      <script type = "text/javascript" src = "https://d3js.org/d3.v4.min.js"></script>
   </head>

   <body>
      <script>
         var width = 400;

         var height = 400;

         var data = [10, 20, 30];

         var colors = ['green', 'purple', 'yellow'];

         var svg = d3
            .select("body")
            .append("svg")
            .attr("width", width)
            .attr("height", height);

         var g = svg.selectAll("g")
            .data(data)
            .enter()
            .append("g")
            .attr("transform", function(d, i) {
               return "translate(0,0)";
            })

         g.append("circle").attr("cx", function(d, i) {
            return i*75 + 50;
         })

         .attr("cy", function(d, i) {
            return 75;
         })

         .attr("r", function(d) {
            return d*1.5;
         })

         .attr("fill", function(d, i){
            return colors[i];
         })

         g.append("text").attr("x", function(d, i) {
            return i * 75 + 25;
         })

         .attr("y", 80)
         .attr("stroke", "teal")
         .attr("font-size", "10px")
         .attr("font-family", "sans-serif").text(function(d) {
            return d;
         });
      </script>
   </body>
</html>
Now, request your browser and following will be the response.
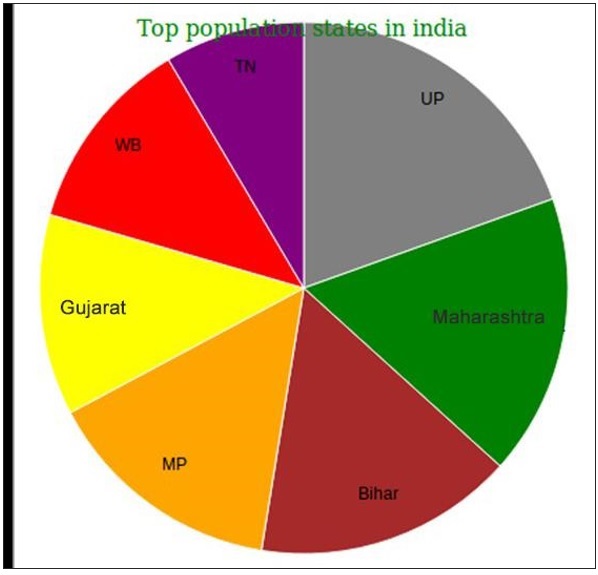
Pie Chart
A pie chart is a circular statistical graph. It is divided into slices to show numerical proportion. Let us understand how to create a pie chart in D3.
Draw a Pie Chart
Before starting to draw a pie chart, we need to understand the following two methods −
- The d3.arc() method and
- The d3.pie() method.
Let us understand both of these methods in detail.
The d3.arc() Method − The d3.arc() method generates an arc. You need to set an inner radius and an outer radius for the arc. If the inner radius is 0, the result will be a pie chart, otherwise the result will be a donut chart, which is discussed in the next section.
The d3.pie()Method − The d3.pie() method is used to generate a pie chart. It takes a data from dataset and calculates the start angle and end angle for each wedge of the pie chart.
Let us draw a pie chart using the following steps.
Step 1 − Applying styles − Let us apply the following style to an arc element.
.arc text {
   font: 12px arial;
   text-anchor: middle;
}

.arc path {
   stroke: #fff;
}

.title {
   fill: green;
   font-weight: italic;
}
Here, fill is used to apply colors. A text-anchor is used to position the text towards the center of an arc.
Step 2 − Define variables − Define the variables in the script as shown below.
<script>
   var svg = d3.select("svg"),
      width = svg.attr("width"),
      height = svg.attr("height"),
      radius = Math.min(width, height) / 2;
</script>
Here,
Width − Width of the SVG.
Height − Height of the SVG.
Radius − It can be calculated using the function of Math.min(width, height) / 2;
Step 3 − Apply Transformation − Apply the following transformation in SVG using the following code.
var g = svg.append("g")
   .attr("transform", "translate(" + width / 2 + "," + height / 2 + ")");
Now add colors using the d3.scaleOrdinal function as given below.
var color = d3.scaleOrdinal(['gray', 'green', 'brown', 'orange']);
Step 4 − Generate a pie chart − Now, generate a pie chart using the function given below.
var pie = d3.pie()
   .value(function(d) { return d.percent; });
Here, you can plot the percentage values. An anonymous function is required to return d.percent and set it as the pie value.
Step 5 − Define arcs for pie wedges − After generating the pie chart, now define arc for each pie wedges using the function given below.
var arc = d3.arc()
   .outerRadius(radius)
   .innerRadius(0);
Here, this arc will be set to the path elements. The calculated radius is set to outerradius, while the innerradius is set to 0.
Step 6 − Add labels in wedges − Add the labels in pie wedges by providing the radius. It is defined as follows.
var label = d3
   .arc()
   .outerRadius(radius)
   .innerRadius(radius - 80);
Step 7 − Read data − This is an important step. We can read data using the function given below.
d3.csv("populations.csv", function(error, data) {
   if (error) {
      throw error;
   }
});
Here, populations.csv contains the data file. The d3.csv function reads data from the dataset. If data is not present, it throws an error. We can include this file in your D3 path.
Step 8 − Load data − The next step is to load data using the following code.
var arc = g.selectAll(".arc")
   .data(pie(data))
   .enter()
   .append("g")
   .attr("class", "arc");
Here, we can assign data to group elements for each of the data values from the dataset.
Step 9 − Append path − Now, append path and assign a class arc to groups as shown below.
arcs.append("path")
   .attr("d", arc)
   .attr("fill", function(d) { return color(d.data.states); });
Here, fill is used to apply the data color. It is taken from the d3.scaleOrdinal function.
Step 10 − Append text − To display the text in labels using the following code.
arc.append("text")
   .attr("transform", function(d) {
      return "translate(" + label.centroid(d) + ")";
   })
.text(function(d) { return d.data.states; });
Here, SVG text element is used to display text in labels. The label arcs that we created earlier using d3.arc() returns a centroid point, which is a position for labels. Finally, we provide data using the d.data.browser.
Step 11 − Append group elements − Append group elements attributes and add class title to color the text and make it italic, which is specified in Step 1 and is defined below.
svg.append("g")
   .attr("transform", "translate(" + (width / 2 - 120) + "," + 20 + ")")
   .append("text")
   .text("Top population states in india")
   .attr("class", "title")
Step 12 − Working Example − To draw a pie chart, we can take a dataset of Indian population. This dataset shows the population in a dummy website, which is defined as follows.
population.csv
states,percent
UP,80.00
Maharastra,70.00
Bihar,65.0
MP,60.00
Gujarat,50.0
WB,49.0
TN,35.0
Let us create a pie chart visualization for the above dataset. Create a webpage piechart.html and add the following code in it.
<!DOCTYPE html>
<html>
   <head>
      <style>
         .arc text {
            font: 12px arial;
            text-anchor: middle;
         }

         .arc path {
            stroke: #fff;
         }

        .title {
            fill: green;
            font-weight: italic;
         }
      </style>

      <script type = "text/javascript" src = "https://d3js.org/d3.v4.min.js"></script>
   </head>

   <body>
      <svg width = "400" height = "400"></svg>
      <script>
         var svg = d3.select("svg"),
            width = svg.attr("width"),
            height = svg.attr("height"),
            radius = Math.min(width, height) / 2;

         var g = svg.append("g")
            .attr("transform", "translate(" + width / 2 + "," + height / 2 + ")");

         var color = d3.scaleOrdinal([
            'gray', 'green', 'brown', 'orange', 'yellow', 'red', 'purple'
         ]);

         var pie = d3.pie().value(function(d) {
            return d.percent;
         });

         var path = d3.arc()
            .outerRadius(radius - 10).innerRadius(0);

         var label = d3.arc()
            .outerRadius(radius).innerRadius(radius - 80);

         d3.csv("populations.csv", function(error, data) {
            if (error) {
               throw error;
            }

            var arc = g.selectAll(".arc")
               .data(pie(data))
               .enter()
               .append("g")
               .attr("class", "arc");

            arc.append("path")
               .attr("d", path)
               .attr("fill", function(d) { return color(d.data.states); });

            console.log(arc)

            arc.append("text").attr("transform", function(d) {
               return "translate(" + label.centroid(d) + ")";
            })

            .text(function(d) { return d.data.states; });
         });

         svg.append("g")
            .attr("transform", "translate(" + (width / 2 - 120) + "," + 20 + ")")
            .append("text").text("Top population states in india")
            .attr("class", "title")
      </script>
   </body>
</html>
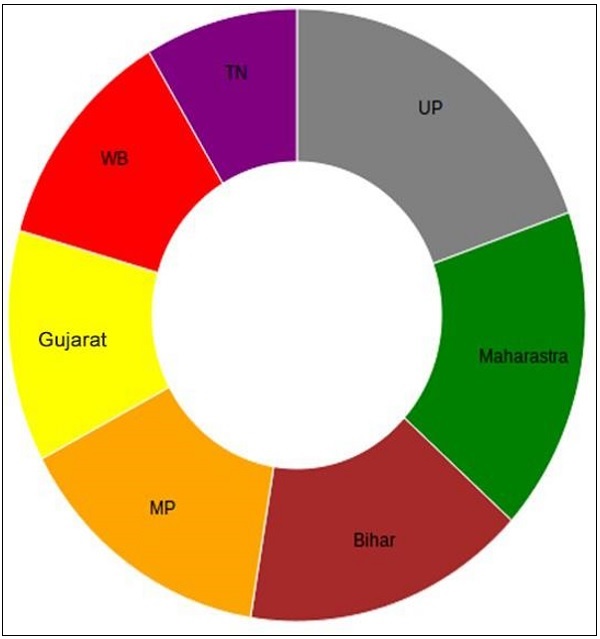
Donut Chart
Donut or Doughnut chart is just a simple pie chart with a hole inside. We can define the hole radius to any size you need, both in percent or pixels. We can create a donut chart instead of a pie chart. Change the inner radius of the arc to use a value greater than zero. It is defined as follows.
var arc = d3.arc()
   .outerRadius(radius)
   .innerRadius(100);
Same as the pie chart coding and with a slightly changed inner radius, we can generate a donut chart. Create a webpage dounutchart.html and add the following changes in it.
Donutchart.html
<!DOCTYPE html>
<html>
   <head>
      <style>
         .arc text {
            font: 12px arial;
            text-anchor: middle;
         }

         .arc path {
            stroke: #fff;
         }

         .title {
            fill: green;
            font-weight: italic;
         }
      </style>
      <script type = "text/javascript" src = "https://d3js.org/d3.v4.min.js"></script>
   </head>

   <body>
      <svg width = "400" height = "400"></svg>
      <script>
         var svg = d3.select("svg"),
            width = svg.attr("width"),
            height = svg.attr("height"),
            radius = Math.min(width, height) / 2;

         var g = svg.append("g")
            .attr("transform", "translate(" + width / 2 + "," + height / 2 + ")");

         var color = d3.scaleOrdinal([
            'gray', 'green', 'brown', 'orange', 'yellow', 'red', 'purple'
         ]);

         var pie = d3.pie().value(function(d) {
            return d.percent;
         });

         var path = d3.arc()
            .outerRadius(radius)
            .innerRadius(100);

         var label = d3.arc()
            .outerRadius(radius)
            .innerRadius(radius - 80);

         d3.csv("populations.csv", function(error, data) {
            if (error) {
               throw error;
            }

            var arc = g.selectAll(".arc")
               .data(pie(data))
               .enter()
               .append("g")
               .attr("class", "arc");
               arc.append("path")
                  .attr("d", path)
                  .attr("fill", function(d) { return color(d.data.states); });

               console.log(arc)

               arc.append("text")
                  .attr("transform", function(d) {
                     return "translate(" + label.centroid(d) + ")";
                   })
                  .text(function(d) { return d.data.states; });
         });

         svg.append("g")
            .attr("transform", "translate(" + (width / 2 - 120) + "," + 20 + ")")
            .append("text")
            .attr("class", "title")
      </script>
   </body>
</html>
Here, we have changed the path variable as −
var path = d3.arc()
   .outerRadius(radius)
   .innerRadius(100);
We set the innerRadius value>0 to generate a donut chart. Now, request the browser and we can see the following response.
D3.js - Graphs
A Graph is a 2-dimensional flat space represented as a rectangle. Graphs have a coordinate space where x = 0 and y = 0 coordinates fall on the bottom left. According to mathematical Cartesian coordinate space, graphs have the X coordinate growing from left to right and the Y coordinate growing from bottom to top.
When we talk about drawing a circle with x = 30 and y = 30 coordinates, we go 30 units from the bottom left to the right and then we go 30 units up.
SVG Coordinate Space
SVG Coordinate Space works in the same way that a mathematical graph coordinate space works, except for two important features −
- SVG Coordinate space has x = 0 and y = 0 coordinates fall on the top left.
- SVG Coordinate space has the Y coordinate growing from top to bottom.
SVG Coordinate Space Graph
When we talk about drawing a circle with x = 30 and y = 30 coordinates in the SVG Coordinate Space, we go 30 units from the top left to the right and then we go down 30 units up. It is defined as follows.
var svgContainer = d3
   .select("body")
   .append("svg")
   .attr("width", 200)
   .attr("height", 200);
Consider, SVG element as a graph 200 units wide and 200 units tall. We now know that the X and Y zero coordinates are at the top left. We also now know that as the Y coordinate grows, it will move from the top to the bottom of our graph. You can style the SVG elements as shown below.
var svgContainer = d3
   .select("body").append("svg")
   .attr("width", 200)
   .attr("height", 200)
   .style("border", "1px solid black");
Graph Example
Let us consider an example of the Line graph.
Line Graph − A line graph is used to visualize the value of something over time. It compares two variables. Each variable is plotted along an axis. A line graph has a vertical axis and a horizontal axis.
In this example graph, we can take csv file records as Indian States Population Growth form year 2006 to 2017. Let us first create a data.csv to show the population records.
Create a new csv file in your D3 folder −
year,population
2006,40
2008,45
2010,48
2012,51
2014,53
2016,57
2017,62
Now, save the file and perform the following steps to draw a line graph in D3. Let us go through each step in detail.
Step 1 − Adding styles − Let us add a style to the line class using the code given below.
.line {
   fill: none;
   stroke: green;
   stroke-width: 5px;
}
Step 2 − Define variables − The SVG attributes are defined below.
var margin = {top: 20, right: 20, bottom: 30, left: 50},
   width = 960 - margin.left - margin.right,
   height = 500 - margin.top - margin.bottom;
Here, the first line defines the four margins, which surround the block where the graph is positioned.
Step 3 − Define line − Draw a new line using the d3.line() function, which is shown below.
var valueline = d3.line()
   .x(function(d) { return x(d.year); })
   .y(function(d) { return y(d.population); });
Here, Year represents the data in the X-axis records and the population refers to the data in the Y-axis.
Step 4 − Append SVG attributes − Append SVG attributes and group elements using the code below.
var svg = d3.select("body").append("svg")
   .attr("width", width + margin.left + margin.right)
   .attr("height", height + margin.top + margin.bottom)
   .append("g").attr("transform",
      "translate(" + margin.left + "," + margin.top + ")");
Here, we have appended the group elements and applied the transformation.
Step 5 − Read data − Now, we can read data from our dataset data.csv.
d3.csv("data.csv", function(error, data) {
   if (error) throw error;
}
Here, the data.csv is not present, it throws an error.
Step 6 − Format data − Now, format the data using the code below.
data.forEach(function(d) {
   d.year = d.year;
   d.population = +d.population;
});
This above code ensures that all the values that are pulled out of the csv file are set and formatted correctly. Each row consists of two values − one value for year and another value for population. The function is pulling out values of year and population one row at a time.
Step 7 − Set scale range − After data formatted, you can set the scale range for X and Y.
x.domain(d3.extent(data, function(d) { return d.year; }));
y.domain([0, d3.max(data, function(d) { return d.population; })]);
Step 8 − Append path − Append path and data as shown below.
svg.append("path").data([data])
   .attr("class", "line").attr("d", valueline);
Step 9 − Add X-axis − Now, you can add X-axis using the code below.
svg.append("g")
   .attr("transform", "translate(0," + height + ")")
   .call(d3.axisBottom(x));
Step 10 − Add Y-axis − We can add Y-axis to the group as shown below.
svg.append("g")
   .call(d3.axisLeft(y));
Step 11 − Working Example − The complete code is given in the following code block. Create a simple webpage linegraphs.html and add the following changes to it.
graph.html
<!DOCTYPE html>
<html>
   <head>
      <script type = "text/javascript" src = "https://d3js.org/d3.v4.min.js"></script>
      <style>
         .line {
            fill: none;
            stroke: green;
            stroke-width: 5px;
         }
      </style>
   </head>

   <body>
      <script>
         // set the dimensions and margins of the graph
         var margin = {top: 20, right: 20, bottom: 30, left: 50},
         width = 960 - margin.left - margin.right,
         height = 500 - margin.top - margin.bottom;

         // set the ranges
         var x = d3.scaleTime().range([0, width]);
         var y = d3.scaleLinear().range([height, 0]);

         // define the line
         var valueline = d3.line()
            .x(function(d) { return x(d.year); })
            .y(function(d) { return y(d.population); });

         // append the svg obgect to the body of the page
         // appends a 'group' element to 'svg'
         // moves the 'group' element to the top left margin
         var svg = d3.select("body").append("svg")
            .attr("width", width + margin.left + margin.right)
            .attr("height", height + margin.top + margin.bottom)
            .append("g").attr("transform",
               "translate(" + margin.left + "," + margin.top + ")");

         // Get the data
         d3.csv("data.csv", function(error, data) {
            if (error) throw error;
            // format the data
            data.forEach(function(d) {
               d.year = d.year;
               d.population = +d.population;
            });

            // Scale the range of the data
            x.domain(d3.extent(data, function(d) { return d.year; }));
            y.domain([0, d3.max(data, function(d) { return d.population; })]);

            // Add the valueline path.
            svg.append("path")
               .data([data])
               .attr("class", "line")
               .attr("d", valueline);

            // Add the X Axis
            svg.append("g")
               .attr("transform", "translate(0," + height + ")")
               .call(d3.axisBottom(x));

            // Add the Y Axis
            svg.append("g")
               .call(d3.axisLeft(y));
         });
      </script>
   </body>
</html>
Now request the browser and we will see the following result.
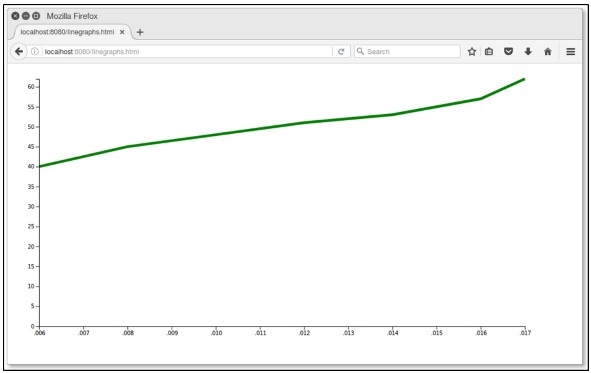
D3.js - Geographies
Geospatial coordinates are often used for weather or population data. D3.js gives us three tools for geographic data −
Paths − They produce the final pixels.
Projections − They turn sphere coordinates into Cartesian coordinates and
Streams − They speed things up.
Before learning what geographies in D3.js are, we should understand the following two terms −
- D3 Geo Path and
- Projections
Let us discuss these two terms in detail.
D3 Geo Path
It is a geographic path generator. GeoJSON generates SVG path data string or renders the path to a Canvas. A Canvas is recommended for dynamic or interactive projections to improve performance. To generate a D3 Geo Path Data Generator, you can call the following function.
d3.geo.path()
Here, the d3.geo.path() path generator function allows us to select which Map Projection we want to use for the translation from Geo Coordinates to Cartesian Coordinates.
For example, if we want to show the map details of India, we can define a path as shown below.
var path = d3.geo.path()
svg.append("path")
   .attr("d", path(states))
Projections
Projections transform spherical polygonal geometry to planar polygonal geometry. D3 provides the following projection implementations.
Azimuthal − Azimuthal projections project the sphere directly onto a plane.
Composite − Composite consists of several projections that are composed into a single display.
Conic − Projects the sphere onto a cone and then unroll the cone onto the plane.
Cylindrical − Cylindrical projections project the sphere onto a containing cylinder, and then unroll the cylinder onto the plane.
To create a new projection, you can use the following function.
d3.geoProjection(project)
It constructs a new projection from the specified raw projection project. The project function takes the longitude and latitude of a given point in radians. You can apply the following projection in your code.
var width = 400
var height = 400
var projection = d3.geo.orthographic()
var projections = d3.geo.equirectangular()
var project = d3.geo.gnomonic()
var p = d3.geo.mercator()
var pro = d3.geo.transverseMercator()
   .scale(100)
   .rotate([100,0,0])
   .translate([width/2, height/2])
   .clipAngle(45);
Here, we can apply any one of the above projections. Let us discuss each of these projections in brief.
d3.geo.orthographic() − The orthographic projection is an azimuthal projection suitable for displaying a single hemisphere; the point of perspective is at infinity.
d3.geo.gnomonic() − The gnomonic projection is an azimuthal projection that projects great circles as straight lines.
d3.geo.equirectangular() − The equirectangular is the simplest possible geographic projection. The identity function. It is neither equal-area nor conformal, but is sometimes used for raster data.
d3.geo.mercator() − The Spherical Mercator projection is commonly used by tiled mapping libraries.
d3.geo.transverseMercator() − The Transverse Mercator projection.
Working Example
Let us create the map of India in this example. To do this, we should adhere to the following steps.
Step 1 − Apply styles − Let us add styles in map using the code below.
<style>
   path {
      stroke: white;
      stroke-width: 0.5px;
      fill: grey;
   }

   .stateTN { fill: red; }
   .stateAP { fill: blue; }
   .stateMP{ fill: green; }
</style>
Here, we have applied particular colors for state TN, AP and MP.
Step 2 − Include topojson script − TopoJSON is an extension of GeoJSON that encodes topology, which is defined below.
<script src = "http://d3js.org/topojson.v0.min.js"></script>
We can include this script in our coding.
Step 3 − Define variables − Add variables in your script, using the code below.
var width = 600;
var height = 400;
var projection = d3.geo.mercator()
   .center([78, 22])
   .scale(680)
   .translate([width / 2, height / 2]);
Here, SVG width is 600 and height is 400. The screen is a two-dimensional space and we are trying to present a three-dimensional object. So, we can grievously distort the land size / shape using the d3.geo.mercator() function.
The center is specified [78, 22], this sets the projections center to the specified location as a two-element array of longitude and latitude in degrees and returns the projection.
Here, the map has been centered on 78 degrees West and 22 degrees North.
The Scale is specified as 680, this sets the projections scale factor to the specified value. If the scale is not specified, it returns the current scale factor, which defaults to 150. It is important to note that scale factors are not consistent across projections.
Step 4 − Append SVG − Now, append the SVG attributes.
var svg = d3.select("body").append("svg")
   .attr("width", width)
   .attr("height", height);
Step 5 − Create path − The following portion of code creates a new geographic path generator.
var path = d3.geo.path()
   .projection(projection);
Here, the path generator (d3.geo.path()) is used to specify a projection type (.projection), which was defined earlier as a Mercator projection using the variable projection.
Step 6 − Generate data − indiatopo.json This file contains so many records, which we can easily download from the following attachment.
Download indiatopo.json file
After the file has been downloaded, we can add it our D3 location. The sample format is shown below.
{"type":"Topology","transform":{"scale":[0.002923182318231823,0.0027427542754275428],
"translate":[68.1862,8.0765]},"objects":
{"states":{"type":"GeometryCollection",
"geometries":[{"type":"MultiPolygon","id":"AP","arcs":
[[[0,1,2,3,4,5,6,7,8,9,10,11,12,13,14,15,16,17,18,19,20,21,22,23,24,
25,26,27,28,29,30,31,32,33,34]],[[35,36,37,38,39,40,41]],[[42]],
[[43,44,45]],[[46]],[[47]],[[48]],[[49]],[[50]],[[51]],[[52,53]],
[[54]],[[55]],[[56]],[[57,58]],[[59]],[[60]],[[61,62,63]],[[64]],
[[65]],[[66]],[[67]],[[68]],[[69]],[[-41,70]],
[[71]],[[72]],[[73]],[[74]],[[75]]],
"properties":{"name":"Andhra Pradesh"}},{"type":"MultiPolygon",
"id":"AR","arcs":[[[76,77,78,79,80,81,82]]],
"properties":{"name":"Arunachal Pradesh"}},{"type":"MultiPolygon",
"id":"AS","arcs":[[[83,84,85,86,87,88,89,90,
91,92,93,94,95,96,97,98,99,100,101,102,103]],
[[104,105,106,107]],[[108,109]]], ......

........................................
Step 7 − Draw map − Now, read the data from the indiatopo.json file and draw the map.
d3.json("indiatopo.json", function(error, topology) {
   g.selectAll("path")
   .data(topojson.object(topology, topology.objects.states)
   .geometries)
   .enter()
   .append("path")
   .attr("class", function(d) { return "state" + d.id; })
   .attr("d", path)
});
Here, we will load the TopoJSON file with the coordinates for the India map (indiatopo.json). Then we declare that we are going to act on all the path elements in the graphic. It is defined as, g.selectAll(path). We will then pull the data that defines the countries from the TopoJSON file.
.data(topojson.object(topology, topology.objects.states)
   .geometries)
Finally, we will add it to the data that we are going to display using the .enter() method and then we append that data as path elements using the .append(path) method.
D3.js - Array API
D3 contains a collection of modules. You can use each module independently or a collection of modules together to perform operations. This chapter explains about the Array API in detail.
What is an Array?
An Array contains a fixed-size sequential collection of elements of the same type. An array is used to store a collection of data, but it is often more useful to think of an array as a collection of variables of the same type.
Configuring API
You can easily configure the API using the script below.
<script src = "https://d3js.org/d3-array.v1.min.js"></script>
<body>
   <script>
   </script>
</body>
Array Statistics API Methods
Following are some of the most important array statistics API methods.
- d3.min(array)
- d3.max(array)
- d3.extent(array)
- d3.sum(array)
- d3.mean(array)
- d3.quantile(array)
- d3.variance(array)
- d3.deviation(array)
Let us discuss each of these in detail.
d3.min(array)
It returns the minimum value in the given array using natural order.
Example − Consider the following script.
<script>
   var data = [20,40,60,80,100];
   console.log(d3.min(data));
</script>
Result − The above script returns the minmum value in the array 20 in your console.
d3.max(array)
It returns the maximum value in a given array.
Example − Consider the following script.
<script>
   var data = [20,40,60,80,100];
   console.log(d3.max(data));
</script>
Result − The above script returns the maximum value in the array (100) in your console.
d3.extent(array)
It returns the minimum and maximum value in the given array.
Example − Consider the following script.
<script>
   var data = [20,40,60,80,100];
   console.log(d3.extent(data));
</script>
Result − The above script returns an extent value [20,100].
d3.sum(array)
It returns the sum of the given array of numbers. If the array is empty, it returns 0.
Example − Consider the following below.
<script>
   var data = [20,40,60,80,100];
   console.log(d3.sum(data));
</script>
Result − The above script returns the sum value is 300.
d3.mean(array)
It returns the mean of the given array of numbers.
Example − Consider the following below.
<script>
   var data = [20,40,60,80,100];
   console.log(d3.mean(data));
</script>
Result − The above script returns the mean value as 60. Similarly, you can check the median value.
d3.quantile(array)
It returns the p-quantile of the given sorted array of numbers, where p is a number in the range[0, 1]. For example, the median can be computed using p = 0.5, the first quartile at p = 0.25, and the third quartile at p = 0.75. This implementation uses the R-7 method, default R programming language and Excel.
Example − Consider the following example.
var data = [20, 40, 60, 80, 100];
d3.quantile(data, 0); // output is 20
d3.quantile(data, 0.5); // output is 60
d3.quantile(data, 1); // output is 100
Similarly, you can check other values.
d3.variance(array)
It returns the variance of the given array of numbers.
Example − Consider the following script.
<script>
   var data = [20,40,60,80,100];
   console.log(d3.variance(data));
</script>
Result − The above script returns the variance value as 1000.
d3.deviation(array)
It returns the standard deviation of the given array. If the array has fewer than two values, it returns as undefined.
Example − Consider the following below.
<script>
   var data = [20,40,60,80,100];
   console.log(d3.deviation(data));
</script>
Result − The above script returns the deviation value as 31.622776601683793.
Example − Let us perform all the Array API methods discussed above using the following script. Create a webpage array.html and add the following changes to it.
<html>
   <head>
      <script type = "text/javascript" src = "https://d3js.org/d3.v4.min.js"></script>
   </head>

   <body>
      <h3>D3 array API</h3>
      <script>
         var data = [20,40,60,80,100];
         console.log(d3.min(data));
         console.log(d3.max(data));
         console.log(d3.extent(data));
         console.log(d3.sum(data));
         console.log(d3.mean(data));
         console.log(d3.quantile(data,0.5));
         console.log(d3.variance(data));
         console.log(d3.deviation(data));
      </script>
   </body>
</html>
Now, request the browser and we will see the following response.
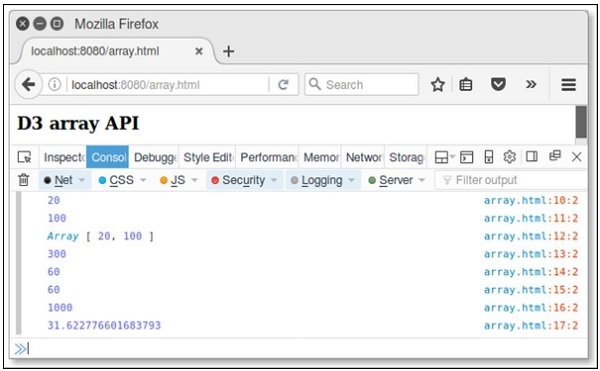
Array Search API Methods
Following are a couple of important Array search API methods.
- d3.scan(array)
- d3.ascending(a, b)
Let us understand both of these in detail.
d3.scan(array)
This method is used to perform a linear scan of the specified array. It returns the index of the least element to the specified comparator. A simple example is defined below.
Example −
var array = [{one: 1}, {one: 10}];
console.log(d3.scan(array, function(a, b) { return a.one - b.one; })); // output is 0
console.log(d3.scan(array, function(a, b) { return b.one - a.one; })); // output is 1
d3.ascending(a, b)
This method is used to perform the comparator function. It can be implemented as −
function ascending(a, b) {
   return a < b ? -1 : a > b ? 1 : a > =  b ? 0 : NaN;
}
If no comparator function is specified to the built-in sort method, the default order is alphabetical. The above function returns -1, if a is less than b, or 1, if a is greater than b, or 0.
Similarly, you can perform descending(a, b) method. It returns -1, if a is greater than b, or 1, if a is less than b, or 0. This function performs reverse natural order.
Example −
Create a webpage array_search.html and add the following changes to it.
<html>
   <head>
      <script type = "text/javascript" src = "https://d3js.org/d3.v4.min.js"></script>
   </head>

   <body>
      <h3>D3 array API</h3>
      <script>
         var array = [{one: 1}, {one: 10}];
         console.log(d3.scan(array, function(a, b) { return a.one - b.one; })); // 0
         console.log(d3.scan(array, function(a, b) { return b.one - a.one; })); // 1
      </script>
   </body>
</html>
Now, request the browser and we will see the following result.
Array Transformations API
Following are some of the most prominent array transformations API methods.
- d3.cross(a, b[, reducer])
- d3.merge(arrays)
- d3.pairs(array[, reducer])
- d3.permute(array, indexes)
- d3.zip(arrays)
Let us understand each of these in detail.
d3.cross(a, b[, reducer])
This method is used to return the Cartesian product of the given two arrays a and b. A simple example is defined below.
d3.cross([10, 20], ["a", "b"]); // output is [[10, "a"], [10, "b"], [20, "a"], [20, "b"]]
d3.merge(arrays)
This method is used to merge the arrays and it is defined below.
d3.merge([[10], [20]]); // output is [10, 20]
d3.pairs(array[, reducer])
This method is used to pair array elements and is defined below.
d3.pairs([10, 20, 30, 40]); // output is [[10, 20], [20, 30], [30, 40]]
d3.permute(array, indexes)
This method is used to perform the permutation from specified array and indexes. You can also perform the values from an object into an array. It is explained below.
var object = {fruit:"mango", color: "yellow"},
   fields = ["fruit", "color"];
d3.permute(object, fields); // output is "mango" "yellow"
d3.zip(arrays)
This method is used to return an array of arrays. If arrays contain only a single array, the returned array contains one-element arrays. If no argument is specified, then the returned array is empty. It is defined below.
d3.zip([10, 20], [30, 40]); // output is [[10, 30], [20, 40]]
Example − Create a webpage array_transform and add the following changes to it.
<html>
   <head>
      <script type = "text/javascript" src = "https://d3js.org/d3.v4.min.js"></script>
   </head>

   <body>
      <h3>D3 array API</h3>
      <script>
         console.log(d3.cross([10, 20], ["a", "b"]));
         console.log(d3.merge([[10], [30]]));
         console.log(d3.pairs([10, 20, 30, 40]));
         var object = {fruit:"mango", color: "yellow"},
         fields = ["fruit", "color"];
         console.log(d3.permute(object, fields));
         console.log(d3.zip([10, 20], [30, 40]));
      </script>
   </body>
</html>
Now, request the browser and we will see the following response.
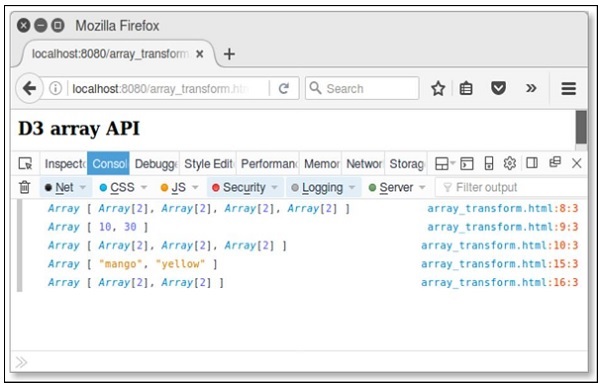
D3.js - Collections API
A collection is simply an object that groups multiple elements into a single unit. It is also called as a container. This chapter explains about collections API in detail.
Configuring API
You can configure the API using the following script.
<script src = "https://d3js.org/d3-collection.v1.min.js"></script>
<script>

</script>
Collections API Methods
Collections API contains objects, maps, sets and nests. Following are the most commonly used collections API methods.
- Objects API
- Maps API
- Sets API
- Nests API
Let us go through each of these API in detail.
Objects API
Object API is one of the important data type. It supports the following methods −
d3.keys(object) − This method contains the object property keys and returns an array of the property names.
d3.values(object) − This method contains the object values and returns an array of property values.
d3.entries(object) − This method is used to return an array containing both keys and values of the specified object. Each entry is an object with a key and value.
Example − Let us consider the following code.
d3.entries({one: 1})
Here, key is one and value is 1.
Example − Create a webpage objects.html and add the following changes to it.
<html>
   <head>
      <script type = "text/javascript" src = "https://d3js.org/d3.v4.min.js"></script>
   </head>

   <body>
      <h3>D3 collection API</h3>
      <script>
         var month = {"jan": 1, "Feb": 2, "mar": 3, "apr": 4};
         console.log(d3.keys(month));
         console.log(d3.values(month));
         console.log(d3.entries(month));
      </script>
   </body>
</html>
Now, request the browser and you will see the following response.
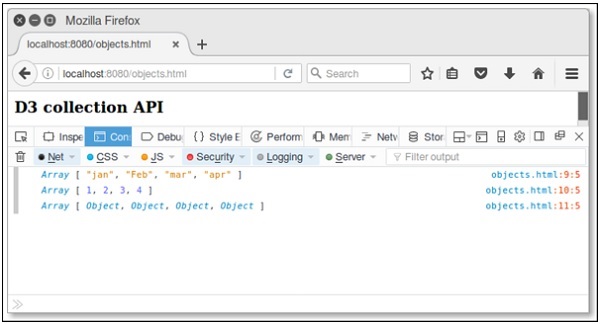
Maps API
A map contains values based on key and value pairs. Each key and value pair is known as an entry. A Map contains only unique keys. It is useful to search, update or delete elements based on the key. Let us go through the various Maps API methods in detail.
d3.map([object[, key]]) − This method is used to create a new map. Object is used to copy all enumerable properties.
map.has(key) − This method is used to check whether map has an entry for the specified key string.
map.get(key) − This method is used to return the value for the specified key string.
map.set(key, value) − This method is used to set the value for the specified key string. If the map previously had an entry for the same key string, the old entry is replaced with the new value.
map.remove(key) − It is used to remove the map entry. If the key is not specified, it returns false.
map.clear() − Removes all entries from this map.
map.keys() − Returns an array of string keys for every entry in this map.
map.values() − Returns an array of values for every entry in this map.
map.entries() − Returns an array of key-value objects for each entry in this map.
(x) map.each(function) − This method is used to call the specified function for each entry in the map.
(xi) map.empty() − Returns true if and only if this map has zero entries.
(xii) map.size() − Returns the number of entries in this map.
Example − Create a webpage maps.html and add the following changes to it.
<html>
   <head>
      <script type = "text/javascript" src = "https://d3js.org/d3.v4.min.js"></script>
   </head>

   <body>
      <h3>D3 collection API</h3>
      <script>
         var month = d3.map([{name: "jan"}, {name: "feb"}],
            function(d) { return d.name; });
         console.log(month.get("jan")); // {"name": "jan"}
         console.log(month.get("apr")); // undefined
         console.log(month.has("feb")); // true

         var map =  d3.map().set("fruit", "mango");
         console.log(map.get("fruit")); // mango
         console.log(map.remove("fruit")); // remove key and return true.
         console.log(map.size());    // size is 0 because key removed.
         console.log(map.empty());   // true
      </script>
   </body>
</html>
Now, request the browser and we will see the following response.
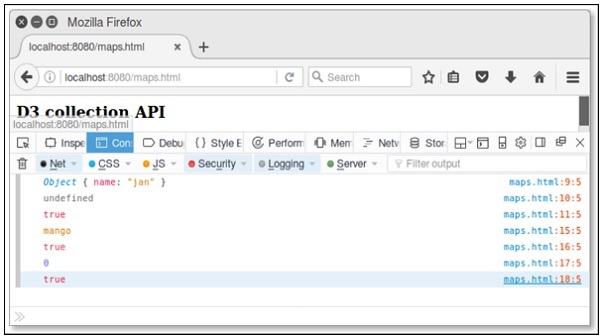
Similarly, you can perform other operations as well.
Sets API
A Set is a Collection that cannot contain duplicate elements. It models the mathematical set abstraction. Let us go through the various Sets API methods in detail.
d3.set([array[, accessor]]) − This method is used to create a new set. Array is used to add string values. An accessor is optional.
set.has(value) − This method is used to check whether the set has an entry for the specified value string.
set.add(value) − It is used to add the specified value string to the set.
set.remove(value) − It is used to remove the set that contains the specified value string.
set.clear() − Removes all the values from this set.
set.values() − This method is used to return an array of values to the set.
set.empty() − Returns true if and only if this set has zero values.
set.size() − Returns the number of values in this set.
Example − Create a webpage sets.html and add the following changes to it.
<html>
   <head>
      <script type = "text/javascript" src = "https://d3js.org/d3.v4.min.js"></script>
   </head>

   <body>
      <h3>D3 collection API</h3>
      <script>
         var fruits =  d3.set().add("mango")
          .add("apple").add("orange");
         console.log(fruits.has("grapes")); // return false.
         console.log(fruits.remove("apple")); //true
         console.log(fruits.size());    // size is 2
         console.log(fruits.empty());   // true
      </script>
   </body>
</html>
Now, request the browser and we will see the following response on our screen.
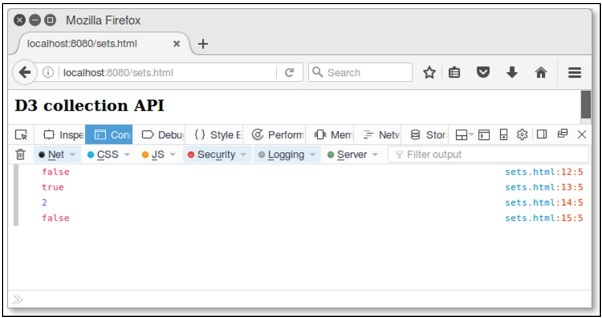
Similarly, we can perform other operations as well.
Nests API
Nesting API contains elements in array and performs in a hierarchical tree structure. Let us go through the various Nests API methods in detail.
d3.nest() − This method is used to create a new nest.
nest.key(key) − This method is used to initialize a new key function. This function is used to invoke each element in an input array and return elements in the group.
nest.sortKeys(comparator) − This method is used to sort keys in a specified comparator. Function is defined as d3.ascending or d3.descending.
nest.sortValues(comparator) − This method is used to sort values in a specified comparator. Comparator function sorts leaf elements.
nest.map(array) − This method is used to apply the specified array and in returning a nested map. Each entry in the returned map corresponds to a distinct key value returned by the first key function. The entry value depends on the number of registered key functions.
nest.object(array) − This method is used to apply the nest operator to the specified array and return a nested object.
nest.entries(array) − This method is used to apply the nest operator to the specified array and return an array of key-values entries.
Consider a simple webpage nest.html to perform the above discussed nest methods.
Example − Let us consider the following example.
<html>
   <head>
      <script type = "text/javascript" src = "https://d3js.org/d3.v4.min.js"></script>
   </head>

   <body>
      <h3>D3 Nest API</h3>
      <script>
         var data = [
            {
               "color" : "red",
               "key" : 1
            },
            {
               "color" : "green",
               "key" : 2
            },
            {
               "color" : "blue",
               "key" : 75
            }
         ]
         var nest =  d3.nest()
            .key(function (d) { return d.color; })
            .entries(data)console.log(nest);
         var filter = nest.filter(function (d) { return d.key = = = 'red' })
         console.log(filter);
      </script>
   </body>
</html>
Now, check the result in a browser and we will see the following result.
Array[3]
0: Object
1: Object
2: Object
length: 3
__proto__: Array[0]

Array[1]
0: Object
length: 1
__proto__: Array[0]
D3.js - Selection API
Selections are powerful data-driven transformation of the document object model (DOM). It is used to set Attributes, Styles, Properties, HTML or Text Content and much more. This chapter explains the selections API in detail.
Configuring the API
You can configure the API directly using the script below.
<script src = "https://d3js.org/d3-selection.v1.min.js"></script>
<script>

</script>
Selection API Methods
Following are the most important methods in selection API.
- d3.selection()
- d3.select(selector)
- d3.selectAll(selector)
- selection.selectAll(selector)
- selection.filter(filter)
- selection.merge(other)
- d3.matcher(selector)
- d3.creator(name)
- selection.each(function)
- selection.call(function[, arguments])
- d3.local()
- local.set(node, value)
- local.get(node)
- local.remove(node)
Let us now discuss each of these in detail.
d3.selection()
This method is used to select the root element. This function can also be used to test for selections or to extend the selection d3js.
d3.select(selector)
This method is used to select the first element that matches the specified selector string.
Example − Let us consider the following example.
var body = d3.select("body");
If the selector is not a string, then it selects the specified node, which is defined below.
d3.select("p").style("color", "red");
d3.selectAll(selector)
This method selects all the elements that match the specified selector string.
Example − Let us consider the following example.
var body = d3.selectAll("body");
If the selector is not a string, then it selects the specified array of nodes, which is defined below.
d3.selectAll("body").style("color", "red");
selection.selectAll(selector)
This method is used to select an element. It selects the descendant elements that match the specified selector string. The elements in the returned selection are grouped by their corresponding parent node in this selection. If no element matches the specified selector for the current element, or if the selector is null, the group at the current index will be empty.
Example − Let us consider the following example.
var b = d3.selectAll("p").selectAll("b");
selection.filter(filter)
This method is used to filter the selection, returning a new selection that contains only the elements for which the specified filter is true.
Example − Let us consider the following example.
var even = d3.selectAll("tr").filter(":nth-child(odd)");
Here, filter a selection of table rows returns only odd.
selection.merge(other)
This method is used to return a new selection merging with the specified other selection.
Example − Let us consider the following example.
var rect = svg.selectAll("rect").data(data);
rect.enter().append("rect").merge(rect);
d3.matcher(selector)
This method is used to assign the specified selector. It returns a function, which returns true.
Example − Let us consider the following example.
var p = selection.filter(d3.matcher("p"));
d3.creator(name)
This method is used to assign the specified element name It returns a function, which creates an element of the given name, assuming that this is the parent element.
Example − Let us consider the following example.
selection.append(d3.creator("p"));
selection.each(function)
This method is used to invoke the specified function for each selected element, in the order passed by the current datum (d), the current index (i) and the current group (nodes) with this as the current DOM element (nodes[i]). It is explained below.
parent.each(function(p, j) {
   d3.select(this)
      .selectAll(".child")
      .text(function(d, i) { return "child " + d.name + " of " + p.name; });
});
selection.call(function[, arguments])
It is used to invoke the specified function exactly once. The syntax is shown below.
function name(selection, first, last) {
   selection.attr("first-name", first).attr("last-name", last);
}
This method can be specified as shown below.
d3.selectAll("p").call(name, "Adam", "David");
d3.local()
D3 local allows you to define the local state that is independent of data.
Example − Let us consider the following example.
var data = d3.local();
Unlike var, the value of each local is also scoped by the DOM.
local.set(node, value)
This method sets the value of this local on the specified node to the value.
Example − Let us consider the following example.
selection.each(function(d)
   { data.set(this, d.value); });
local.get(node)
This method returns the value of this local on the specified node. If the node does not define this local, then it returns the value from the nearest ancestor that defines it.
local.remove(node)
This method deletes this locals value from the specified node. It returns true, if the node defined, otherwise returns false.
D3.js - Paths API
Paths are used to draw Rectangles, Circles, Ellipses, Polylines, Polygons, Straight Lines, and Curves. SVG Paths represent the outline of a shape that can be Stroked, Filled, Used as a Clipping Path, or any combination of all three. This chapter explains Paths API in detail.
Configuring Paths
You can configure the Paths API using the script below.
<script src = "https://d3js.org/d3-path.v1.min.js"></script>
<script>

</script>
Paths API Methods
Some of the most commonly used Paths API methods are briefly described as follows.
d3.path() − This method is used to create a new path.
path.moveTo(x, y) − This method is used to move the specified x and y values.
path.closePath() − This method is used to close the current path.
path.lineTo(x, y) − This method is used to create a line from current point to defined x,y values.
path.quadraticCurveTo(cpx, cpy, x, y) − This method is used to draw a quadratic curve from current point to the specified point.
path.bezierCurveTo(cpx1, cpy1, cpx2, cpy2, x, y) − This method is used to draw a bezier curve from current point to the specified point.
path.arcTo(x1, y1, x2, y2, radius) − This method is used to draw a circular arc from the current point to a specified point (x1, y1) and end the line between the specified points (x1, y1) and (x2, y2).
path.arc(x, y, radius, startAngle, endAngle[, anticlockwise]) − This method is used to draw a circular arc to the specified center (x, y), radius, startAngle and endAngle. If anticlockwise value is true then the arc is drawn in the anticlockwise direction, otherwise it is drawn in the clockwise direction.
path.rect(x, y, w, h) − This method is used to create new sub path containing just the four points (x, y), (x + w, y), (x + w, y + h), (x, y + h). With these four points connected by straight lines marks the subpath as closed. Equivalent to context.rect and uses SVGs lineto commands.
path.toString() − Returns the string representation of this path according to SVGs path data specification.
Example
Let us draw a simple line in D3 using path API. Create a webpage linepath.html and add the following changes in it.
<!DOCTYPE html>
<meta charset = "UTF-8">
   <head>
      <title>SVG path line Generator</title>
   </head>

   <style>
      path {
         fill: green;
         stroke: #aaa;
      }
   </style>

   <body>
      <svg width = "600" height = "100">
         <path transform = "translate(200, 0)" />
      </svg>

      <script src = "https://d3js.org/d3.v4.min.js"></script>
      <script>
         var data = [[0, 20], [50, 30], [100, 50], [200, 60], [300, 90]];
         var lineGenerator = d3.line();
         var pathString = lineGenerator(data);
         d3.select('path').attr('d', pathString);
      </script>
   </body>
</html>
Now, request the browser and we will see the following result.
D3.js - Scales API
D3.js provides scale functions to perform data transformations. These functions map an input domain to an output range.
Configuring API
We can configure the API directly using the following script.
<script src = "https://d3js.org/d3-array.v1.min.js"></script>
<script src = "https://d3js.org/d3-collection.v1.min.js"></script>
<script src = "https://d3js.org/d3-color.v1.min.js"></script>
<script src = "https://d3js.org/d3-format.v1.min.js"></script>
<script src = "https://d3js.org/d3-interpolate.v1.min.js"></script>
<script src = "https://d3js.org/d3-time.v1.min.js"></script>
<script src = "https://d3js.org/d3-time-format.v2.min.js"></script>
<script src = "https://d3js.org/d3-scale.v1.min.js"></script>
<script>

</script>
Scales API Methods
D3 provides the following important scaling methods for different types of charts. Let us understand then in detail.
d3.scaleLinear() − Constructs a continuous linear scale where we can input data (domain) maps to the specified output range.
d3.scaleIdentity() − Construct a linear scale where the input data is the same as the output.
d3.scaleTime() − Construct a linear scale where the input data is in the dates and the output in numbers.
d3.scaleLog() − Construct a logarithmic scale.
d3.scaleSqrt() − Construct a square root scale.
d3.scalePow() − Construct an exponential scale.
d3.scaleSequential() − Construct a sequential scale where output range is fixed by interpolator function.
d3.scaleQuantize() − Construct a quantize scale with discrete output range.
d3.scaleQuantile() − Construct a quantile scale where the input sample data maps to the discrete output range.
d3.scaleThreshold() − Construct a scale where the arbitrary input data maps to the discrete output range.
d3.scaleBand() − Band scales are like ordinal scales except the output range is continuous and numeric.
d3.scalePoint() − Construct a point scale.
d3.scaleOrdinal() − Construct an ordinal scale where the input data includes alphabets and are mapped to the discrete numeric output range.
Before doing a working example, let us first understand the following two terms −
Domain − The Domain denotes minimum and maximum values of your input data.
Range − The Range is the output range, which we would like the input values to map to...
Working Example
Let us perform the d3.scaleLinear function in this example. To do this, you need to adhere to the following steps −
Step 1 − Define variables − Define SVG variables and data using the coding below.
var data = [100, 200, 300, 400, 800, 0]
   var width = 500,
      barHeight = 20,
      margin = 1;
Step 2 − Create linear scale − Use the following code to create a linear scale.
var scale = d3.scaleLinear()
   .domain([d3.min(data), d3.max(data)])
   .range([100, 400]);
Here, for the minimum and maximum value for our domain manually, we can use the built-in d3.min() and d3.max() functions, which will return minimum and maximum values respectively from our data array.
Step 3 − Append SVG attributes − Append the SVG elements using the code given below.
var svg = d3.select("body")
   .append("svg")
   .attr("width", width)
   .attr("height", barHeight * data.length);
Step 4 − Apply transformation − Apply the transformation using the code below.
var g = svg.selectAll("g")
   .data(data).enter().append("g")
   .attr("transform", function (d, i) {
      return "translate(0," + i * barHeight + ")";
});
Step 5 − Append rect elements − Append the rect elements to scaling as shown below.
g.append("rect")
   .attr("width", function (d) {
      return scale(d);
   })
   .attr("height", barHeight - margin)
Step 6 − Display data − Now display the data using the coding given below.
g.append("text")
   .attr("x", function (d) { return (scale(d)); })
   .attr("y", barHeight / 2)
   .attr("dy", ".35em")
   .text(function (d) { return d; });
Step 7 − Working Example − Now, let us create a bar chart using the d3.scaleLinear() function as follows.
Create a webpage scales.html and add the following changes to it.
<!DOCTYPE html>
<html>
   <head>
      <script type = "text/javascript" src = "https://d3js.org/d3.v4.min.js"></script>
   </head>

   <body>
      <script>
         var data = [100, 200, 300, 350, 400, 250]
         var width = 500, barHeight = 20, margin = 1;

         var scale = d3.scaleLinear()
            .domain([d3.min(data), d3.max(data)])
            .range([100, 400]);

         var svg = d3.select("body")
            .append("svg")
            .attr("width", width)
            .attr("height", barHeight * data.length);

         var g = svg.selectAll("g")
            .data(data)
            .enter()
            .append("g")
            .attr("transform", function (d, i) {
               return "translate(0," + i * barHeight + ")";
         });

         g.append("rect")
         .attr("width", function (d) {
            return scale(d);
         })

         .attr("height", barHeight - margin)
         g.append("text")
         .attr("x", function (d) { return (scale(d)); })
         .attr("y", barHeight / 2).attr("dy", ".35em")
         .text(function (d) { return d; });
      </script>
   </body>
</html>
The above code will display the following result in the browser.
D3.js - Axis API
D3 provides functions to draw axes. An axis is made of Lines, Ticks and Labels. An axis uses a Scale, so each axis will need to be given a scale to work with.
Configuring the Axis API
You can configure the API using the following script.
<script src = "https://d3js.org/d3-axis.v1.min.js"></script>
<script>

</script>
Axis API Methods
D3 provides the following significant functions to draw axes. They are described in brief as follows.
d3.axisTop() − This method is used to create a top horizontal axis.
d3.axisRight() − This method is used to create a vertical right-oriented axis.
d3.axisBottom() − This method is used to create a bottom horizontal axis.
d3.axisLeft() − It creates left vertical axis.
Working Example
Let us learn how to add the x and y-axis to a graph. To do this, we need to adhere to the steps given below.
Step 1 − Define variables − Define SVG and data variables using the code below.
var width = 400, height = 400;
var data = [100, 150, 200, 250, 280, 300];
var svg = d3.select("body")
   .append("svg")
   .attr("width", width)
   .attr("height", height);
Step 2 − Create a scale linear function − Create a scale linear function for both x and y axis as defined below.
var xscale = d3.scaleLinear()
   .domain([0, d3.max(data)])
   .range([0, width - 100]);

var yscale = d3.scaleLinear()
   .domain([0, d3.max(data)])
   .range([height/2, 0]);
Here, we have created a linear scale and specified the domain and the range.
Step 3 − Add scales to x-axis − Now, we can add scales to the x-axis using the following code.
var x_axis = d3.axisBottom()
   .scale(xscale);
Here, we use d3.axisBottom to create our x-axis and provide it with the scale, which is defined earlier.
Step 4 − Add scales to the y-axis − Use the following code to add scales to the y-axis.
var y_axis = d3.axisLeft()
   .scale(yscale);
Here, we use the d3.axisLeft to create our y-axis and provide it with the scale we defined above.
Step 5 − Apply transformation − You can append a group element and insert the x, y axis, which is defined below.
svg.append("g")
   .attr("transform", "translate(50, 10)")
   .call(y_axis);
Step 6 − Append group elements − Apply transition and group elements using the following code.
var xAxisTranslate = height/2 + 10;
svg.append("g")
   .attr("transform", "translate(50, " + xAxisTranslate  +")")
   .call(x_axis)
Step 7 − Working Example − The complete code listing is given in the following code block. Create a webpage axes.html and add the following changes to it.
<html>
   <head>
      <script type = "text/javascript" src = "https://d3js.org/d3.v4.min.js"></script>
      <style>
         svg text {
            fill: purple;
            font: 12px sans-serif;
            text-anchor: end;
         }
      </style>
   </head>

   <body>
      <script>
         var width = 400, height = 400;
         var data = [100, 120, 140, 160, 180, 200];
         var svg = d3.select("body")
            .append("svg")
            .attr("width", width)
            .attr("height", height);

         var xscale = d3.scaleLinear()
            .domain([0, d3.max(data)])
            .range([0, width - 100]);

         var yscale = d3.scaleLinear()
            .domain([0, d3.max(data)])
            .range([height/2, 0]);

         var x_axis = d3.axisBottom().scale(xscale);

         var y_axis = d3.axisLeft().scale(yscale);

         svg.append("g")
            .attr("transform", "translate(50, 10)")
            .call(y_axis);

         var xAxisTranslate = height/2 + 10;

         svg.append("g")
            .attr("transform", "translate(50, " + xAxisTranslate  +")")
            .call(x_axis)
      </script>
   </body>
</html>
Now, request the browser and we will see the following changes.
D3.js - Shapes API
This chapter discusses the different shape generators in D3.js.
Configuring API
You can configure the Shapes API using the following script.
<script src = "https://d3js.org/d3-path.v1.min.js"></script>
<script src = "https://d3js.org/d3-shape.v1.min.js"></script>
<script>

</script>
Shapes Generators
D3.js supports different shapes. Let us go through the prominent shapes in detail.
Arcs API
The arc generator produces a circle or annulus shape. We have used these API methods in the previous pie charts chapter. Let us understand the various Arcs API methods in detail.
d3.arc() − This method is used to create a new arc generator.
arc(args) − It is used to generate an arc with the specified given arguments. Default settings with an object radii and angles is defined below.
<script>
   var arc = d3.arc();
   arc({
      innerRadius: 0,
      outerRadius: 100,
      startAngle: 0,
      endAngle: Math.PI / 2
   });
</script>
arc.centroid(args) − This method is used to compute the midpoint [x, y] of the centerline of the arc with the specified arguments.
arc.innerRadius([radius]) − This method is used to set the inner radius from the given radius and return an arc generator. It is defined below −
function innerRadius(d) {
   return d.innerRadius;
}
arc.outerRadius([radius]) − This method is used to set the outer radius from the given radius and return an arc generator. It is defined as follows.
function outerRadius(d) {
   return d.outerRadius;
}
arc.cornerRadius([radius]) − This method is used to set the corner radius from the given radius and return an arc generator. It is defined as follows.
function cornerRadius() {
   return 0;
}
If the corner radius is greater than zero, the corners of the arc are rounded using the circles of the given radius. The corner radius may not be larger than (outerRadius - innerRadius) / 2.
arc.startAngle([angle]) − This method is used to set the start angle to the function from the given angle. It is defined as follows −
function startAngle(d) {
   return d.startAngle;
}
arc.endAngle([angle]) − This method is used to set the end angle to the function from the given angle. It is defined as follows.
function endAngle(d) {
   return d.endAngle;
}
arc.padAngle([angle]) − This method is used to set the pad angle to the function from the given angle. It is defined as follows.
function padAngle() {
   return d && d.padAngle;
}
(x) arc.padRadius([radius]) − This method is used to set the pad radius to the specified function from the given radius. The pad radius determines the fixed linear distance separating adjacent arcs, defined as padRadius *padAngle.
(xi) arc.context([context]) − This method is used to set the context and return an arc generator.
Pies API
This API is used to create a Pie generator. We have performed these API methods in the previous chapter. We will discuss all those methods in detail.
d3.pie() − Constructs a new pie generator with the default settings.
pie(data[, arguments]) − This method is used to generate a pie for the given array values. It returns an array of objects. Objects are datum's arc angles. Each object has the following properties −
data − the input datum; the corresponding element in the input data array.
value − the numeric value of the arc.
index − index of the arc.
startAngle − the start angle of the arc.
endAngle − the end angle of the arc.
padAngle − the pad angle of the arc.
pie.value([value]) − This method is used to set the value to the specified function and generates a pie. It is defined as follows −
function value(d) {
   return d;
}
pie.sort([compare]) − This method is used to sort the data to the specified function and generates pie. The comparator function is defined as follows.
pie.sort(function(a, b)
   { return a.name.localeCompare(b.name); }
);
Here, the compare function takes two arguments a and b, each element from the input data array. If the arc for a should be before the arc for b, then the comparator must return a number less than zero. If the arc for a should be after the arc for b, then the comparator must return a number greater than zero.
pie.sortValues([compare]) − This method is used to compare the value from the given function and generates a pie. The function is defined as follows.
function compare(a, b) {
   return b - a;
}
pie.startAngle([angle]) − This method is used to set the start angle of the pie to the specified function. If the angle is not specified, it returns the current start angle. It is defined as follows.
function startAngle() {
   return 0;
}
pie.endAngle([angle]) − This method is used to set the end angle of the pie to the specified function. If angle is not specified, it returns the current end angle. It is defined as follows.
function endAngle() {
   return 2 * Math.PI;
}
pie.padAngle([angle]) − This method is used to set the pad angle to the specified function and generates the pie. The function is defined as follows.
function padAngle() {
   return 0;
}
Lines API
Lines API is used to generate a line. We have used these API methods in the Graphs chapter. Let us go through each methods in detail.
d3.line() − This method is used to create a new line generator.
line(data) − This method is used to generate a line for the given array of data.
line.x([x]) − This method is used to set the x accessor to the specified function and generates a line. The function is defined below,
function x(d) {
   return d[0];
}
line.y([y]) − This method is used to set the y accessor to the specified function and generates a line. The function is defined as follows.
function y(d) {
   return d[1];
}
line.defined([defined]) − This method is used to set the defined accessor to the specified function. It is defined as follows.
function defined() {
  return true;
}
line.curve([curve]) − It is used to set the curve and generates the line.
line.context([context]) − This method is used to set the context and generates a line. If the context is not specified, it returns null.
d3.lineRadial() − This method is used to create new radial line; it is equivalent to the Cartesian line generator.
lineRadial.radius([radius]) − This method is used to draw a radial line and the accessor returns the radius. It takes distance from the origin(0,0).
In the next chapter, we will learn about the Colors API in D3.js.
D3.js - Colors API
Colors are displayed combining RED, GREEN and BLUE. Colors can be specified in the following different ways −
- By color names
- As RGB values
- As hexadecimal values
- As HSL values
- As HWB values
The d3-color API provides representations for various colors. You can perform conversion and manipulation operations in API. Let us understand these operations in detail.
Configuring API
You can directly load API using the following script.
<script src = "https://d3js.org/d3-color.v1.min.js"></script>
<script>

</script>
Basic Operations
Let us go through the basic color operations in D3.
Convert color value to HSL − To convert color value to HSL, use the following Example −
var convert = d3.hsl("green");
You can rotate the hue by 45 as shown below.
convert.h + = 45;
Similarly, you can change the saturation level as well. To fade the color value, you can change the opacity value as shown below.
convert.opacity = 0.5;
Color API Methods
Following are some of the most important Color API Methods.
- d3.color(specifier)
- color.opacity
- color.rgb()
- color.toString()
- color.displayable()
- d3.rgb(color)
- d3.hsl(color)
- d3.lab(color)
- d3.hcl(color)
- d3.cubehelix(color)
Let us understand each of these Color API Methods in detail.
d3.color(specifier)
It is used to parse the specified CSS color and return RGB or HSL color. If specifier is not given, then null is returned.
Example − Let us consider the following example.
<script>
   var color = d3.color("green");  // asign color name directly
   console.log(color);
</script>
We will see the following response on our screen −
{r: 0, g: 128, b: 0, opacity: 1}
color.opacity
If we want to fade the color, we can change the opacity value. It is in the range of [0, 1].
Example − Let us consider the following example.
<script>
   var color = d3.color("green");
   console.log(color.opacity);
</script>
We will see the following response on the screen −
1
color.rgb()
It returns the RGB value for the color. Let us consider the following example.
<script>
   var color = d3.color("green");
   console.log(color.rgb());
</script>
We will see the following response on our screen.
{r: 0, g: 128, b: 0, opacity: 1}
color.toString()
It returns a string representing the color according to the CSS Object Model specification. Let us consider the following example.
<script>
   var color = d3.color("green");
   console.log(color.toString());
</script>
We will see the following response on our screen.
rgb(0, 128, 0)
color.displayable()
Returns true, if the color is displayable. Returns false, if RGB color value is less than 0 or greater than 255, or if the opacity is not in the range [0, 1]. Let us consider the following example.
<script>
   var color = d3.color("green");
   console.log(color.displayable());
</script>
We will see the following response on our screen.
true
d3.rgb(color)
This method is used to construct a new RGB color. Let us consider the following example.
<script>
   console.log(d3.rgb("yellow"));
   console.log(d3.rgb(200,100,0));
</script>
We will see the following response on the screen.
{r: 255, g: 255, b: 0, opacity: 1}
{r: 200, g: 100, b: 0, opacity: 1}
d3.hsl(color)
It is used to construct a new HSL color. Values are exposed as h, s and l properties on the returned instance. Let us consider the following example.
<script>
   var hsl = d3.hsl("blue");
   console.log(hsl.h + =  90);
   console.log(hsl.opacity = 0.5);
</script>
We will see the following response on the screen.
330
0.5
d3.lab(color)
It constructs a new Lab color. The channel values are exposed as l, a and b properties on the returned instance.
<script>
   var lab = d3.lab("blue");
   console.log(lab);
</script>
We will see the following response on the screen.
{l: 32.29701093285073, a: 79.18751984512221, b: -107.8601617541481, opacity: 1}
d3.hcl(color)
Constructs a new HCL color. The channel values are exposed as h, c and l properties on the returned instance. Let us consider the following example.
<script>
   var hcl = d3.hcl("blue");
   console.log(hcl);
</script>
We will see the following response on the screen.
{h: 306.2849380699878, c: 133.80761485376166, l: 32.29701093285073, opacity: 1}
d3.cubehelix(color)
Constructs a new Cubehelix color. Values are exposed as h, s and l properties on the returned instance. Let us consider the following example.
<script>
   var hcl = d3.hcl("blue");
   console.log(hcl);
</script>
We will see the following response on the screen,
{h: 236.94217167732103, s: 4.614386868039719, l: 0.10999954957200976, opacity: 1}
Working Example
Let us create a new webpage color.html to perform all the color API methods. The complete code listing is defined below.
<html>
   <head>
      <script type = "text/javascript" src = "https://d3js.org/d3.v4.min.js"></script>
   </head>

   <body>
      <h3>D3 colors API</h3>
      <script>
         var color = d3.color("green");
         console.log(color);
         console.log(color.opacity);
         console.log(color.rgb());
         console.log(color.toString());
         console.log(color.displayable());
         console.log(d3.rgb("yellow"));
         console.log(d3.rgb(200,100,0));
         var hsl = d3.hsl("blue");
         console.log(hsl.h + =  90);
         console.log(hsl.opacity = 0.5);
         var lab = d3.lab("blue");
         console.log(lab);
         var hcl = d3.hcl("blue");
         console.log(hcl);
         var cube = d3.cubehelix("blue");
         console.log(cube);
      </script>
   </body>
</html>
Now, request the browser and we will see the following response.
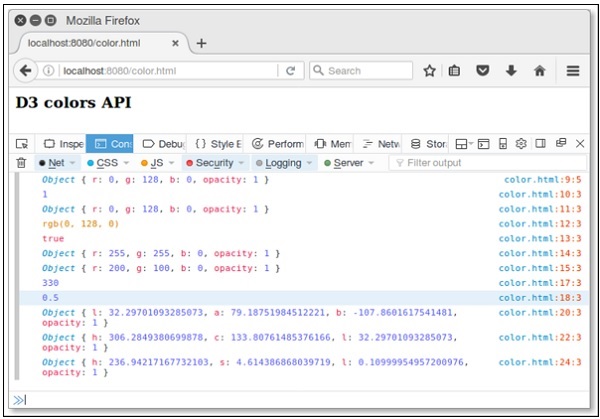
D3.js - Transitions API
D3 Transitions take a selection of elements and for each element; it applies a transition to a part of the current definition of the element.
Configuring API
You can configure the transition API using the following script.
<script src = "https://d3js.org/d3-color.v1.min.js"></script>
<script src = "https://d3js.org/d3-dispatch.v1.min.js"></script>
<script src = "https://d3js.org/d3-ease.v1.min.js"></script>
<script src = "https://d3js.org/d3-interpolate.v1.min.js"></script>
<script src = "https://d3js.org/d3-selection.v1.min.js"></script>
<script src = "https://d3js.org/d3-timer.v1.min.js"></script>
<script src = "https://d3js.org/d3-transition.v1.min.js"></script>
<script>

</script>
Transition API Methods
Let us go through the Transition API methods in detail.
Selecting Elements
Let us discuss the various selecting elements in detail.
selection.transition([name]) − This method is used to return a new selection transition with the name. If a name is not specified, it returns null.
selection.interrupt([name]) − This method is used to interrupt the selected elements of the transition with the name and is defined below.
selection.interrupt().selectAll("*").interrupt();
d3.interrupt(node[, name]) − This method is used to interrupt the transition of the specified name on the specified node.
d3.transition([name]) − This method is used to return a new transition with the specified name.
transition.select(selector) − This method is used to select the first element that matches the specified selector and returns a transition on the resulting selection, which is defined below.
transition
   .selection()
   .select(selector)
   .transition(transition)
transition.selectAll(selector) − This method is used to select all the elements that matches the specified selector and returns a transition on the resulting selection. It is defined below −
transition .selection() .selectAll(selector) .transition(transition)
transition.filter(filter) − This method is used to select the elements matching the specified filter, they are defined below.
transition .selection() .filter(filter) .transition(transition)
transition.merge(other) − This method is used to merge the transition with other transition. It is defined below.
transition .selection() .merge(other.selection()) .transition(transition)
transition.transition() − This method is used to return a new transition on the selected elements. It is scheduled to start when the transition stops. The new transition inherits this transitions name, duration and easing.
Example − Let us consider the following example.
d3.selectAll(".body")
.transition()
// fade to yellow.
.style("fill", "yellow")
.transition()
// Wait for five second. Then change blue, and remove.
.delay(5000)
.style("fill", "blue")
.remove();
Here, the body fades to yellow and starts just five seconds before the last transition.
d3.active(node[, name]) − This method is used to return the transition on the specified node with the name.
Timing Methods
Let us go through the transition timing API methods in detail.
transition.delay([value]) − This method is used to set the transition delay to the specified value. If a function is evaluated for each selected element, it is passed to the current datum d and index i', with the context as the current DOM element. If a value is not specified, returns the current value of the delay for the first (non-null) element in the transition. It is defined below,
transition.delay(function(d, i) { return i * 10; });
transition.duration([value]) − This method is used to set the transition duration to the specified value. If a value is not specified, returns the current value of the duration for the first (non-null) element in the transition.
transition.ease([value]) − This method is used to ease the transition value for selected elements. The easing function is invoked for each frame of the animation and passed the normalized time t in the range [0, 1]. If a value is not specified, it returns the current easing function for the first (non-null) element in the transition.
In the next chapter, we will discuss the drag and drop concept in d3.js.
D3.js - Dragging API
Drag and drop is one of the most familiar concept in d3.js. This chapter explains dragging and its methods in detail.
Installation
We can directly include dragging API using the following script.
<script src = "https://d3js.org/d3-dispatch.v1.min.js"></script> <script src = "https://d3js.org/d3-selection.v1.min.js"></script> <script src = "https://d3js.org/d3-drag.v1.min.js"></script>
Dragging API Methods
Following are some of the most important dragging API methods in D3.js.
- d3.drag()
- drag(selection)
- drag.container([container])
- drag.filter([filter])
- drag.subject([subject])
- drag.clickDistance([distance])
- drag.on(typenames, [listener])
- d3.dragDisable(window)
- d3.dragEnable(window[, noclick])
Let us now understand each of these in detail.
d3.drag()
This method is used to create a new dragging. You can call this method using the following script.
<script> var drag = d3.drag(); </script>
drag(selection)
This method is used to apply the dragging to the specified selection. You can invoke this function using selection.call. A simple example is defined below.
d3.select(".node").call(d3.drag().on("drag", mousemove));
Here, the drag behavior applied to the selected elements is via selection.call.
drag.container([container])
It is used to set the container to the specified function for dragging. If a container is not specified, it returns the current accessor. To drag any graphical elements with a Canvas, you can redefine the container as itself. It is defined below.
function container() {
return this;
}
drag.filter([filter])
It is used to set the filter for the specified function. If the filter is not specified, it returns the current filter as defined below.
function filter() {
return !d3.event.button;
}
drag.subject([subject])
It is used to set the subject to the specified function for dragging and is defined below.
function subject(d) {
return d = = null ? {x: d3.event.x, y: d3.event.y} : d;
}
Here, the subject represents the thing being dragged. For example, if you want to drag rectangle elements in SVG, the default subject is datum of the rectangle being dragged.
drag.clickDistance([distance])
This method is used to set the maximum distance for clicking a mousedown and mouseup event. If distance is not specified, it points to zero.
drag.on(typenames, [listener])
This method is used to set the event listener for the specified typenames for dragging. The typenames is a string containing one or more typename separated by whitespace. Each typename is a type, optionally followed by a period (.) and a name, such as drag.one and drag.two. This type should be from one of the following −
start − starts a new pointer.
drag − drags an active pointer.
end − Inactive an active pointer.
d3.dragDisable(window)
This method is used to disable the drag and drop selection. It prevents mousedown event action. Most of the selected browsers supports this action by default. If not supported, you can set the CSS property to none.
d3.dragEnable(window[, noclick])
This method is used to enable the drag and drop selection on the specified window location. It is used to call mouseup event action. If you assign the noclick value is true then click event expires a zero millisecond timeout.
Dragging API - Drag Events
The D3.event method is used to set the drag event. It consists of the following fields −
Target − It represents the drag behavior.
Type − It is a string and can be any one of the following start, drag or end.
Subject − The drag subject, defined by drag.subject.
event.on(typenames, [listener])
The event object exposes the event.on method to perform dragging. It is defined as follows.
d3.event.on("drag", dragged).on("end", ended);
D3.js - Zooming API
Zooming helps to scale your content. You can focus on a particular region using the click-and-drag approach. In this chapter, we will discuss Zooming API in detail.
Configuring API
You can load the Zooming API directly from the d3js.org using the following script.
<script src = "https://d3js.org/d3-color.v1.min.js"></script> <script src = "https://d3js.org/d3-dispatch.v1.min.js"></script> <script src = "https://d3js.org/d3-ease.v1.min.js"></script> <script src = "https://d3js.org/d3-interpolate.v1.min.js"></script> <script src = "https://d3js.org/d3-selection.v1.min.js"></script> <script src = "https://d3js.org/d3-timer.v1.min.js"></script> <script src = "https://d3js.org/d3-transition.v1.min.js"></script> <script src = "https://d3js.org/d3-drag.v1.min.js"></script> <script src = "https://d3js.org/d3-zoom.v1.min.js"></script> <body> <script> </script> </body>
Zooming API Methods
Following are some of the most commonly used Zooming API Methods.
- d3.zoom()
- zoom(selection)
- zoom.transform(selection, transform)
- zoom.translateBy(selection, x, y)
- zoom.translateTo(selection, x, y)
- zoom.scaleTo(selection, k)
- zoom.scaleBy(selection, k)
- zoom.filter([filter])
- zoom.wheelDelta([delta])
- zoom.extent([extent])
- zoom.scaleExtent([extent])
- zoom.translateExtent([extent])
- zoom.clickDistance([distance])
- zoom.duration([duration])
- zoom.interpolate([interpolate])
- zoom.on(typenames[, listener])
Let us go through all these Zooming API methods in brief.
d3.zoom()
It creates a new zoom behavior. We can access it using the script below.
<script> var zoom = d3.zoom(); </script>
zoom(selection)
It is used to apply the zoom transformation on a selected element. For example, you can instantiate a mousedown.zoom behavior using the following syntax.
selection.call(d3.zoom().on("mousedown.zoom", mousedowned));
zoom.transform(selection, transform)
It is used to set the current zoom transform of the selected elements to the specified transform. For example, we can reset the zoom transform to the identity transform using the syntax below.
selection.call(zoom.transform, d3.zoomIdentity);
We can also reset the zoom transform to the identity transform for 1000 milliseconds using the following syntax.
selection.transition().duration(1000).call(zoom.transform, d3.zoomIdentity);
zoom.translateBy(selection, x, y)
It is used to translate the current zoom transform of the selected elements by x and y values. You can specify x and y translation values either as numbers or as functions that returns numbers. If a function is invoked for the selected element, then it is passed through the current datum d and index i' for DOM. A sample code is defined below.
zoom.translateBy(selection, x, y) {
zoom.transform(selection, function() {
return constrain(this.__zoom.translate(
x = = = "function" ? x.apply(this, arguments) : x,
y = = = "function" ? y.apply(this, arguments) : y
);
}
};
zoom.translateTo(selection, x, y)
It is used to translate the current zoom transform of the selected elements to the specified position of x and y.
zoom.scaleTo(selection, k)
It is used to scale the current zoom transform of the selected elements to k. Here, k is a scale factor, specified as numbers or functions.
zoom.scaleTo = function(selection, k) {
zoom.transform(selection, function() {
k = = = "function" ? k.apply(this, arguments) : k;
});
};
zoom.scaleBy(selection, k)
It is used to scale the current zoon transform of the selected elements by k. Here, k is a scale factor, specified either as numbers or as functions that returns numbers.
zoom.scaleBy = function(selection, k) {
zoom.scaleTo(selection, function() {
var k0 = this.__zoom.k,
k1 = k = = = "function" ? k.apply(this, arguments) : k;
return k0 * k1;
});
};
zoom.filter([filter])
It is used to set the filter to the specified function for zoom behavior. If the filter is not specified, it returns the current filter as shown below.
function filter() {
return !d3.event.button;
}
zoom.wheelDelta([delta])
The value of Δ is returned by the wheel delta function. If delta is not specified, it returns the current wheel delta function.
zoom.extent([extent])
It is used to set the extent to the specified array points. If the extent is not specified, it returns the current extent accessor, which defaults to [[0, 0], [width, height]], where width is the client width of the element and height is its client height.
zoom.scaleExtent([extent])
It is used to set the scale extent to the specified array of numbers [k0, k1]. Here, k0 is the minimum allowed scale factor. While, k1 is the maximum allowed scale factor. If extent is not specified, it returns the current scale extent, which defaults to [0, ∞]. Consider the sample code that is defined below.
selection
.call(zoom)
.on("wheel", function() { d3.event.preventDefault(); });
The user can try to zoom by wheeling, when already at the corresponding limit of the scale extent. If we want to prevent scrolling on wheel input regardless of the scale extent, register a wheel event listener to prevent the browser default behavior.
zoom.translateExtent([extent])
If the extent is specified, it sets the translate extent to the specified array of points. If extent is not specified, it returns the current translate extent, which defaults to [[-∞, -∞], [+∞, +∞]].
zoom.clickDistance([distance])
This method is used to set the maximum distance that the zoomable area can move between up and down, which will trigger a subsequent click event.
zoom.duration([duration])
This method is used to set the duration for zoom transitions on double-click and double-tap to the specified number of milliseconds and returns the zoom behavior. If the duration is not specified, it returns the current duration, which defaults to 250 milliseconds, which is defined below.
selection
.call(zoom)
.on("dblclick.zoom", null);
zoom.interpolate([interpolate])
This method is used to interpolate for zoom transitions to the specified function. If interpolate is not specified, it returns the current interpolation factory, which defaults to d3.interpolateZoom.
zoom.on(typenames[, listener])
If the listener is specified, it sets the event listener for the specified typenames and returns the zoom behavior. The typenames is a string containing one or more typename separated by whitespace. Each typename is a type, optionally followed by a period (.) and a name, such as zoom.one and zoom.second. The name allows multiple listeners to be registered for the same type. This type must be from one of the following −
Start − after zooming begins (such as on mousedown).
Zoom − after a change to the zoom transform (such as on mousemove).
End − after zooming ends (such as on mouseup ).
In the next chapter, we will discuss the different requests API in D3.js.
D3.js - Requests API
D3.js provides a request API to perform the XMLHttpRequest. This chapter explains the various requests API in detail.
XMLHttpRequest
XMLHttpRequest is the built-in http client to emulate the browser XMLHttpRequest object. It can be used with JS designed for browsers to improve reuse of code and allow the use of existing libraries.
You can include the module in your project and use as the browser-based XHR object as explained below.
var XMLHttpRequest = require("xmlhttprequest").XMLHttpRequest;
var xhr = new XMLHttpRequest();
It supports both async and synchronous requests and it performs GET, POST, PUT, and DELETE requests.
Configuring Requests
You can load directly from d3js.org using the script below.
<script src = "https://d3js.org/d3-request.v1.min.js"></script>
<script>
d3.json("/path/to/sample.json", callback);
</script>
Here, the requests API have built-in support for parsing JSON, CSV and TSV. You can parse additional formats by using the request or text directly.
Load Text Files
To load a text file, use the following syntax.
d3.text("/path/to/sample.txt", function(error, text) {
if (error) throw error;
console.log(text);
});
Parsing CSV files
To load and parse a CSV file, use the following syntax.
d3.csv("/path/to/sample.csv", function(error, data) {
if (error) throw error;
console.log(data);
});
Similarly, you can load the JSON and TSV files as well.
Working Example
Let us go through a simple example for how to load and parse a CSV file. Before that, you need to create a CSV file named sample.csv in your d3 application folder as shown below.
Num1,Num2 1,2 3,4 5,6 7,8 9,10
Now, create a webpage requests.html using the following script.
<!DOCTYPE html>
<html>
<head>
<script type = "text/javascript" src = "https://d3js.org/d3.v4.min.js"></script>
</head>
<body>
<h3> D3.js Requests API </h3>
<script>
d3.csv("sample.csv", function(data) {
console.log(data);
});
</script>
</body>
</html>
Now, request the browser and you will see the following response,
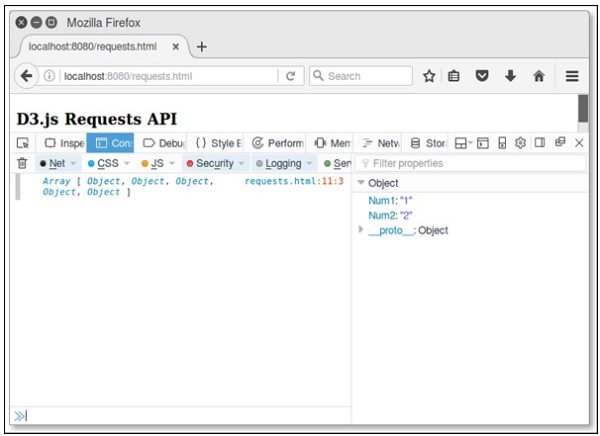
Requests API Methods
Following are some of the most commonly used Requests API methods.
- d3.request(url[, callback])
- request.header(name[, value])
- request.mimeType([type])
- request.user([value])
- request.password([value])
- request.timeout([timeout])
- request.get([data])
- request.post([data])
- request.send(method[, data])
- request.abort()
- d3.csv(url[[, row], callback])
Let us now discuss each of these in brief.
d3.request(url[, callback])
It returns a new request for the given URL. If a callback is assigned, it is considered as a calling request otherwise request is not yet called. It is defined below.
d3.request(url) .get(callback);
You can post some query parameters using the following syntax.
d3.request("/path/to/resource")
.header("X-Requested-With", "XMLHttpRequest")
.header("Content-Type", "application/x-www-form-urlencoded")
.post("a = 2&b = 3", callback);
If you wish to specify a request header or a mime type, you must not specify a callback to the constructor.
request.header(name[, value])
It is used to set the value to the request header with the specified name. If no value is specified, it removes the request header with the specified name. It is defined below.
d3.request(url)
.header("Accept-Language", "en-US")
.header("X-Requested-With", "XMLHttpRequest")
.get(callback);
Here, X-Requested-With header to XMLHttpRequest is a default request.
request.mimeType([type])
It is used to assign the mime type to the given value. It is defined below.
d3.request(url)
.mimeType("text/csv")
.get(callback);
request.user([value])
It is used to assign the username for authentication. If a username is not specified, it defaults to null.
request.password([value])
If a value is specified, it sets the password for authentication.
request.timeout([timeout])
If a timeout is specified, it sets the timeout to the specified number of milliseconds.
request.get([data])
This method is used to send the request with the GET method. It is defined below.
request.send("GET", data, callback);
request.post([data])
This method is used to send the request with the POST method. It is defined below.
request.send("POST", data, callback);
request.send(method[, data])
This method is used to send the request using the given GET or POST method.
request.abort()
This method is used to abort the request.
d3.csv(url[[, row], callback])
Returns a new request for the CSV file at the specified URL with the default Mime type text/csv. The following syntax shows with no callback.
d3.request(url)
.mimeType("text/csv")
.response(function(xhr) { return d3.csvParse(xhr.responseText, row); });
If you specify a callback with the POST method, it is defined below.
d3.request(url)
.mimeType("text/csv")
.response(function(xhr) { return d3.csvParse(xhr.responseText, row); })
.post(callback);
Example
Create a csv file named lang.csv in your d3 application root folder directory and add the following changes to it.
Year,Language,Author 1972,C,Dennis Ritchie 1995,Java,James gosling 2011,D3 js,Mike Bostock
Create a webpage csv.html and add the following script to it.
<!DOCTYPE html>
<html>
<head>
<script type = "text/javascript" src = "https://d3js.org/d3.v4.min.js"></script>
</head>
<body>
<h3> D3.js request API</h3>
<script>
d3.csv("lang.csv", function(d) {
return {
year: new Date(+d.Year, 0, 1), // convert "Year" column to Date
language: d.Language,
author: d.Author,
};
}, function(error, rows) {
console.log(error);
console.log(rows[0].year);
});
</script>
</body>
</html>
Now, request the browser and we will see the following response.
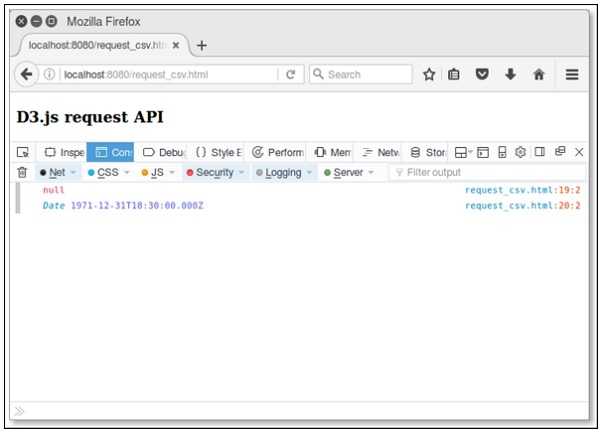
D3.js - Delimiter-Separated Values API
A delimiter is a sequence of one or more characters used to specify the boundary between separate, independent regions in plain text or other data. A field delimiter is a sequence of comma-separated values. Well, delimiter-separated values are comma separated values (CSV) or tab-separated values (TSV). This chapter explains the delimiter separated values in detail.
Configuring API
We can easily load the API using the following syntax.
<script src = "https://d3js.org/d3-dsv.v1.min.js"></script> <script> var data = d3.csvParse(string); </script>
API methods
Following are the various API methods of the delimiter-separated values.
- d3.csvParse(string[, row])
- d3.csvParseRows(string[, row])
- d3.csvFormat(rows[, columns])
- d3.csvFormatRows(rows)
- d3.tsvParse(string[, row])
- d3.tsvParseRows(string[, row])
- d3.tsvFormat(rows[, columns])
- d3.tsvFormatRows(rows)
Let us go through each of these API methods in detail.
d3.csvParse(string[, row])
This method is used to parse the csv format. Consider the file data.csv that is shown below.
year,population 2006,40 2008,45 2010,48 2012,51 2014,53 2016,57 2017,62
Now, we can apply the above-given function.
Example − Let us consider the following example.
var data = d3.csvParse(string, function(d) {
return {
year: new Date(+d.Year, 0, 1), // lowercase and convert "Year" to Date
population: d.population
};
});
Here, it Parses the specified string in the delimiter-separated values. It returns an array of objects representing the parsed rows.
d3.csvParseRows(string[, row])
This method is used to parse the csv format equivalent to rows.
var data = d3.csvParseRows(string, function(d, i) {
return {
year: new Date(+d[0], 0, 1), // convert first colum column to Date
population: d[1],
};
});
It parses each row in the csv file.
d3.csvFormat(rows[, columns])
This method is used to format the csv rows and columns.
Example − Let us consider the following example.
var string = d3.csvFormat(data, ["year", "population"]);
Here, if the columns are not specified, the list of the column names that forms the header row is determined by the union of all properties on all the objects in the rows. If columns are specified, it is an array of strings representing the column names.
d3.csvFormatRows(rows)
This method is used to format the csv rows.
Example − Let us consider the following example.
var string = d3.csvFormatRows(data.map(function(d, i) {
return [
d.year.getFullYear(), // Assuming d.year is a Date object.
d.population
];
}));
Here, it formats the specified array of string rows as delimiter-separated values, returning a string.
d3.tsvParse(string[, row])
This method is used to parse the tsv format. It is similar to csvParse.
d3.tsvParseRows(string[, row])
This method is used to parse the tsv format equivalent to rows. It is similar to csvParseRows function.
d3.tsvFormat(rows[, columns])
This method is used to format the tsv rows and columns.
d3.tsvFormatRows(rows)
This method is used to format the tsv rows.
D3.js - Timer API
Timer API module is used to perform the concurrent animations with synchronized timing delay. It uses requestAnimationFrame for animation. This chapter explains Timer API module in detail.
requestAnimationFrame
This method tells the browser that you wish to perform an animation and requests that the browser call a specified function to update an animation.
Configuring Timer
We can easily load the timer directly from d3js.org by using the following script.
<script src = "https://d3js.org/d3-timer.v1.min.js"></script> <script> var timer = d3.timer(callback); </script>
Timer API Methods
The Timer API supports the following important methods. All of these are explained in detail as follows.
d3.now()
This method returns the current time.
d3.timer(callback[, delay[, time]])
This method is used to schedule a new timer and invokes the timer until stopped. You can set a numeric delay in MS, but it is optional otherwise, it defaults to zero. If time is not specified, it is considered as d3.now().
timer.restart(callback[, delay[, time]])
Restart a timer with the specified callback and optional delay and time.
timer.stop()
This method stops the timer, preventing subsequent callbacks.
d3.timeout(callback[, delay[, time]])
It is used to stop the timer on its first callback. Callback is passed as the elapsed time.
d3.interval(callback[, delay[, time]])
It is invoked on a particular time delay interval. If delay is not specified, it takes the timer time.
Example
Create a webpage timer.html and add the following script to it.
<!DOCTYPE html>
<html>
<head>
<script type = "text/javascript" src = "https://d3js.org/d3.v4.min.js"></script>
</head>
<body>
<h3> Timer API </h3>
<script>
var timer = d3.timer(function(duration) {
console.log(duration);
if (duration > 150) timer.stop();
}, 100);
</script>
</body>
</html>
We will see the following response on the screen.
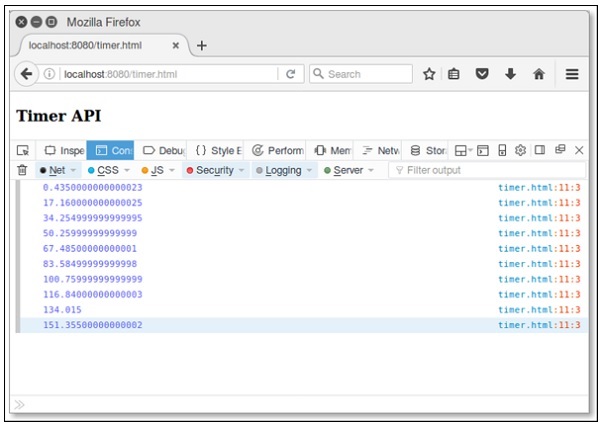
D3.js - Working Example
Let us perform an animated bar chart in this chapter. For this example, we take the data.csv file used in the previous chapter of the population records as dataset and generate an animated bar chart.
To do this, we need to perform the following steps −
Step 1 − Apply styles − Apply CSS styles using the coding given below.
<style>
.bar {
fill: green;
}
.highlight {
fill: red;
}
.title {
fill: blue;
font-weight: bold;
}
</style>
Step 2 − Define variables − Let us define the SVG attributes using the script below.
<script>
var svg = d3.select("svg"), margin = 200,
width = svg.attr("width") - margin,
height = svg.attr("height") - margin;
</script>
Step 3 − Append text − Now, append text and apply the transformation using the coding below.
svg.append("text")
.attr("transform", "translate(100,0)")
.attr("x", 50)
.attr("y", 50)
.attr("font-size", "20px")
.attr("class", "title")
.text("Population bar chart")
Step 4 − Create scale range − In this step, we can create a scale range and append the group elements. It is defined below.
var x = d3.scaleBand().range([0, width]).padding(0.4),
y = d3.scaleLinear()
.range([height, 0]);
var g = svg.append("g")
.attr("transform", "translate(" + 100 + "," + 100 + ")");
Step 5 − Read data − We have already created the data.csv file in our previous examples. The same file, we have used here.
year,population 2006,40 2008,45 2010,48 2012,51 2014,53 2016,57 2017,62
Now, read the above file using the code below.
d3.csv("data.csv", function(error, data) {
if (error) {
throw error;
}
Step 6 − Set domain − Now, set the domain using the coding below.
x.domain(data.map(function(d) { return d.year; }));
y.domain([0, d3.max(data, function(d) { return d.population; })]);
Step 7 − Add X-axis − Now, you can add the X-axis to the transformation. It is shown below.
g.append("g")
.attr("transform", "translate(0," + height + ")")
.call(d3.axisBottom(x)).append("text")
.attr("y", height - 250).attr("x", width - 100)
.attr("text-anchor", "end").attr("font-size", "18px")
.attr("stroke", "blue").text("year");
Step 8 − Add Y-axis − Add the Y-axis to the transformation using the code given below.
g.append("g")
.append("text").attr("transform", "rotate(-90)")
.attr("y", 6).attr("dy", "-5.1em")
.attr("text-anchor", "end").attr("font-size", "18px")
.attr("stroke", "blue").text("population");
Step 9 − Append group elements − Now, append the group elements and apply transformation to Y-axis as defined below.
g.append("g")
.attr("transform", "translate(0, 0)")
.call(d3.axisLeft(y))
Step 10 − Select the bar class − Now, select all the elements in the bar class as defined below.
g.selectAll(".bar")
.data(data).enter()
.append("rect")
.attr("class", "bar")
.on("mouseover", onMouseOver)
.on("mouseout", onMouseOut)
.attr("x", function(d) { return x(d.year); })
.attr("y", function(d) { return y(d.population); })
.attr("width", x.bandwidth())
.transition()
.ease(d3.easeLinear)
.duration(200)
.delay(function (d, i) {
return i * 25;
})
.attr("height", function(d) { return height - y(d.population); });
});
Here, we added the listener event for the mouseout and mouseover to perform animation. It applies the animation, when the mouse hovers over a particular bar and goes out of it. These functions are explained in the following step.
The .ease(d3.easeLinear) function is used to perform apparent motion in animation. It processes the slow-in and the slow-out motion with a duration of 200. The delay can be calculated using −
.delay(function (d, i) {
return i * 25;
})
Step 11 − Mouseover event handler function − Let us create a mouseover event handler to handle a mouse event as shown below.
function onMouseOver(d, i) {
d3.select(this)
.attr('class', 'highlight');
d3.select(this)
.transition()
.duration(200)
.attr('width', x.bandwidth() + 5)
.attr("y", function(d) { return y(d.population) - 10; })
.attr("height", function(d) { return height - y(d.population) + 10; });
g.append("text")
.attr('class', 'val')
.attr('x', function() {
return x(d.year);
})
.attr('y', function() {
return y(d.value) - 10;
})
}
Here, in the mouseover event, we want to increase the bar width and height, and the bar color of the selected bar to red. For the color, we have added a class highlight, which changes the color of the selected bar to red.
A transition function to the bar for the duration of 200 milliseconds. When we increase the width of the bar by 5px, and the height by 10px, the transition from the previous width and height of the bar to the new width and height will be for the duration of 200 milliseconds.
Next, we calculated a new y value to the bar, so that the bar does not distort due to the new height value.
Step 12 − Mouseout event handler function − Let us create a mouseout event handler to handle a mouse event. It is defined below.
function onMouseOut(d, i) {
d3.select(this).attr('class', 'bar');
d3.select(this)
.transition()
.duration(400).attr('width', x.bandwidth())
.attr("y", function(d) { return y(d.population); })
.attr("height", function(d) { return height - y(d.population); });
d3.selectAll('.val')
.remove()
}
Here, in the mouseout event, we want to remove the selection features that we had applied in the mouseover event. Therefore, we revert the bar class to the original bar class and restore the original width and height of the selected bar and restore the y value to the original value.
The d3.selectAll(.val).remove() function is used to remove the text value we had added during the bar selection.
Step 13 − Working Example − The complete program is given in the following code block. Create a webpage animated_bar.html and add the following changes to it.
<!DOCTYPE html>
<html>
<head>
<style>
.bar {
fill: green;
}
.highlight {
fill: red;
}
.title {
fill: blue;
font-weight: bold;
}
</style>
<script src = "https://d3js.org/d3.v4.min.js"></script>
<title> Animated bar chart </title>
</head>
<body>
<svg width = "500" height = "500"></svg>
<script>
var svg = d3.select("svg"),
margin = 200, width = svg.attr("width") - margin,
height = svg.attr("height") - margin;
svg.append("text")
.attr("transform", "translate(100,0)")
.attr("x", 50).attr("y", 50)
.attr("font-size", "20px")
.attr("class", "title")
.text("Population bar chart")
var x = d3.scaleBand().range([0, width]).padding(0.4),
y = d3.scaleLinear().range([height, 0]);
var g = svg.append("g")
.attr("transform", "translate(" + 100 + "," + 100 + ")");
d3.csv("data.csv", function(error, data) {
if (error) {
throw error;
}
x.domain(data.map(function(d) { return d.year; }));
y.domain([0, d3.max(data, function(d) { return d.population; })]);
g.append("g")
.attr("transform", "translate(0," + height + ")")
.call(d3.axisBottom(x))
.append("text")
.attr("y", height - 250)
.attr("x", width - 100)
.attr("text-anchor", "end")
.attr("font-size", "18px")
.attr("stroke", "blue").text("year");
g.append("g")
.append("text")
.attr("transform", "rotate(-90)")
.attr("y", 6)
.attr("dy", "-5.1em")
.attr("text-anchor", "end")
.attr("font-size", "18px")
.attr("stroke", "blue")
.text("population");
g.append("g")
.attr("transform", "translate(0, 0)")
.call(d3.axisLeft(y))
g.selectAll(".bar")
.data(data)
.enter()
.append("rect")
.attr("class", "bar")
.on("mouseover", onMouseOver)
.on("mouseout", onMouseOut)
.attr("x", function(d) { return x(d.year); })
.attr("y", function(d) { return y(d.population); })
.attr("width", x.bandwidth()).transition()
.ease(d3.easeLinear).duration(200)
.delay(function (d, i) {
return i * 25;
})
.attr("height", function(d) { return height - y(d.population); });
});
function onMouseOver(d, i) {
d3.select(this)
.attr('class', 'highlight');
d3.select(this)
.transition()
.duration(200)
.attr('width', x.bandwidth() + 5)
.attr("y", function(d) { return y(d.population) - 10; })
.attr("height", function(d) { return height - y(d.population) + 10; });
g.append("text")
.attr('class', 'val')
.attr('x', function() {
return x(d.year);
})
.attr('y', function() {
return y(d.value) - 10;
})
}
function onMouseOut(d, i) {
d3.select(this)
.attr('class', 'bar');
d3.select(this)
.transition()
.duration(200)
.attr('width', x.bandwidth())
.attr("y", function(d) { return y(d.population); })
.attr("height", function(d) { return height - y(d.population); });
d3.selectAll('.val')
.remove()
}
</script>
</body>
</html>
Now, request the browser and we will see the following response.
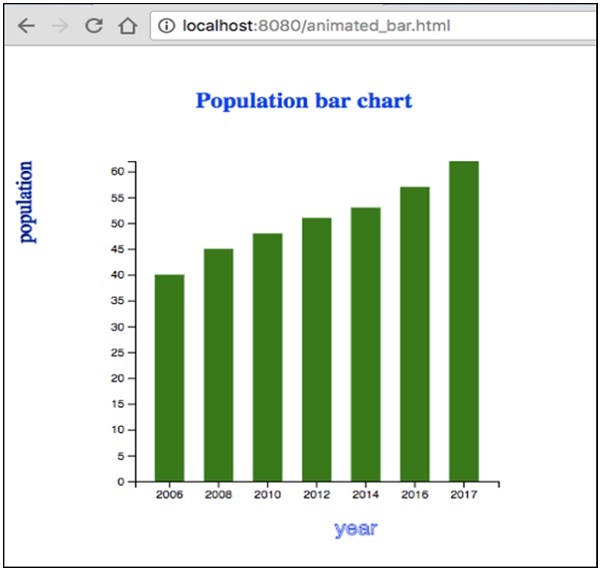
If we select any bar, it will be highlighted in red color. D3 is a general-purpose visualization library that deals with the transformation of data into information, documents, elements, etc., and ultimately helps in creating data visualization.
