
Article Categories
- All Categories
-
 Data Structure
-
 Networking
-
 RDBMS
RDBMS
-
 Operating System
-
 Java
Java
-
 MS Excel
-
 iOS
iOS
-
 HTML
HTML
-
 CSS
CSS
-
 Android
-
 Python
-
 C Programming
-
 C++
C++
-
 C#
C#
-
 MongoDB
-
 MySQL
MySQL
-
 Javascript
-
 PHP
PHP
-
 Economics & Finance
Collecting MySQL Statistics and Metrics
In this article, we are going to learn about collecting Mysql statistics and Metrics.
Performance Dashboard
View statistics about server performance in a dashboard. Open a query tab, choose the Management tab, and then click Dashboard in the Performance section of the Navigator sidebar to display the dashboard. The informational structure of the Administration - Dashboard tab is depicted in the following image.
Performance: Dashboard
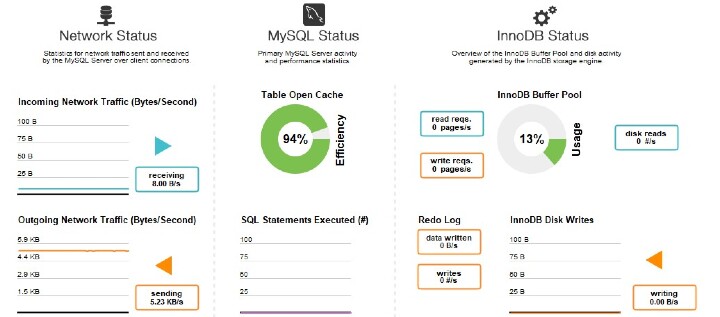
Network Status
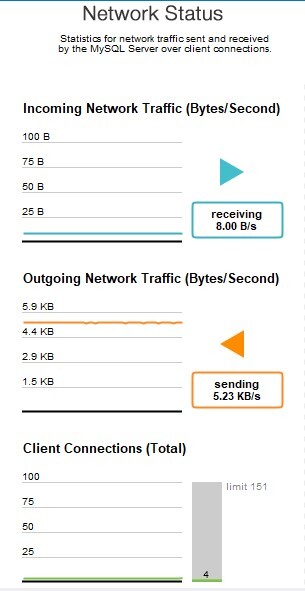
This displays data on network traffic that the MySQL server has transmitted and received via client connections. The incoming network traffic, outgoing network traffic, and client connections are examples of data points.
MySQL Status
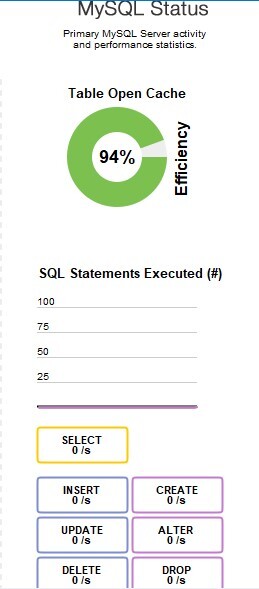
This displays the key performance and activity metrics for the MySQL server. Table Open Cache Effectiveness, SQL Statements Executed, and SELECT, INSERT, UPDATE, DELETE, CREATE, ALTER, and DROP statement counts (per second) are among the data items.
InnoDB Status
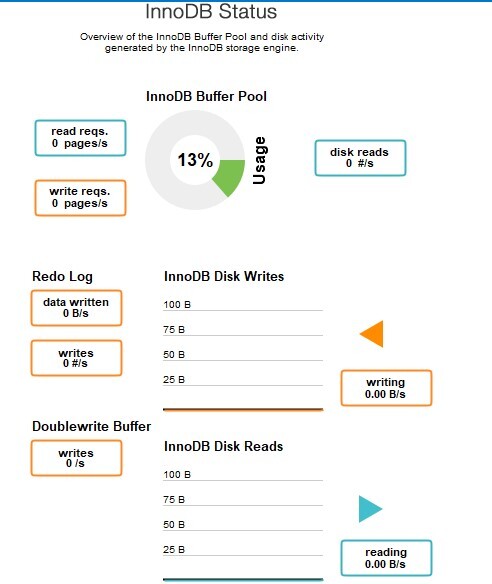
This gives a general overview of the disc activity produced by the InnoDB storage engine as well as the InnoDB Buffer Pool. Three groupings of data points are created ?
Note
To reveal more details, such as a total count, hover your cursor over a graph.
Usage
Read Requests: The quantity of logical read requests that InnoDB has made to the buffer pool per second.
Write Requests: The quantity of logical write requests that InnoDB has sent to the buffer pool (per second).
Number of logical reads that InnoDB was unable to satisfy from the buffer pool, measured in disc reads. These had to be read from the disc as a result.
The amount of the InnoDB buffer pool that is currently being used. The graphic can be hovered over to see further details like Usage Rate and Pages Free.
Writes
Data Written ? The total amount of writes to the InnoDB redo log file.
Writes ? The quantity of actual writes made to the InnoDB redo log file
InnoDB Disk Writes: Move your cursor over this dynamic graph to observe how many disc writes occurred during a particular second. The range includes the previous 120 seconds.
Writing ? The total amount of data (in bytes) that the InnoDB storage engine has written using file operations.
Reads
Doublewrite Buffer Writes ? the total quantity of doublewrite operations.
InnoDB Disk Reads ? Move your cursor over this dynamic graph to observe how many disc reads occurred during a particular second. The range includes the previous 120 seconds.
Reading ? The total amount of data (in bytes) that the InnoDB storage engine has read from files.
Performance Schema Reports
Through practical high-level reports, performance schema-based reports offer insight into MySQL server operations. For the purpose of analyzing the performance of your MySQL databases, MySQL Workbench generates over 20 reports using the SYS views on the Performance Schema. Reports assist in identifying high-cost SQL statements, analyzing IO hotspots, and reviewing wait data and InnoDB engine characteristics. See MySQL sys Schema for more details about the SYS schema.
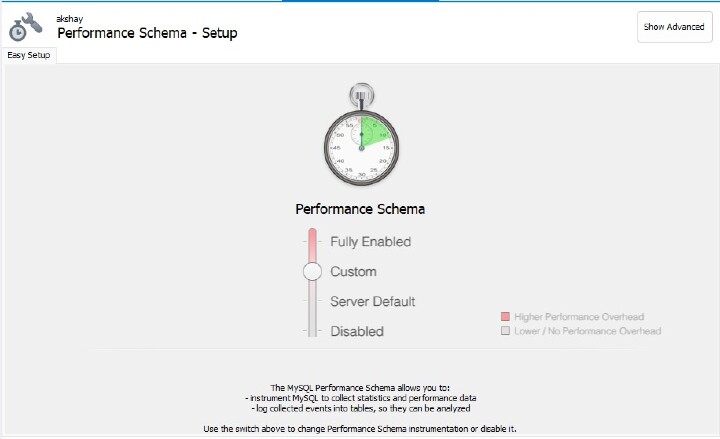
Configuration and Installation
A graphical user interface for customising and optimising the Performance Schema instrumentation (see the figure that follows). This initially loads an Easy Setup tab, which is adequate for the majority of people. Stop your pointer over Fully Enabled and click the circle on the slide bar to activate every Performance Schema instrument that is currently accessible.
MySQL Workbench uses version 5.7 of MySQL Server, which includes the SYS schema by default. However, Workbench instals its own bundled version of the SYS schema for MySQL Server 5.6.
Note ? The MySQL server chooses the size of the saved digested query.
Setup for Performance Schema: Simple
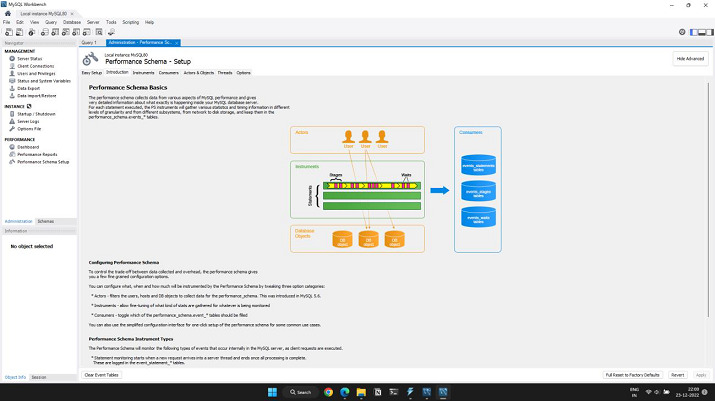
There are ways to fine-tune the Performance Schema instrumentation by clicking Show Advanced. The tab for Introduction is selected in the following figure along with the tabs for advanced instrumentation.
Setup of the Performance Schema: Introduction

674 Views
