
Article Categories
- All Categories
-
 Data Structure
-
 Networking
-
 RDBMS
RDBMS
-
 Operating System
-
 Java
Java
-
 MS Excel
-
 iOS
iOS
-
 HTML
HTML
-
 CSS
CSS
-
 Android
-
 Python
-
 C Programming
-
 C++
C++
-
 C#
C#
-
 MongoDB
-
 MySQL
MySQL
-
 Javascript
-
 PHP
PHP
-
 Economics & Finance
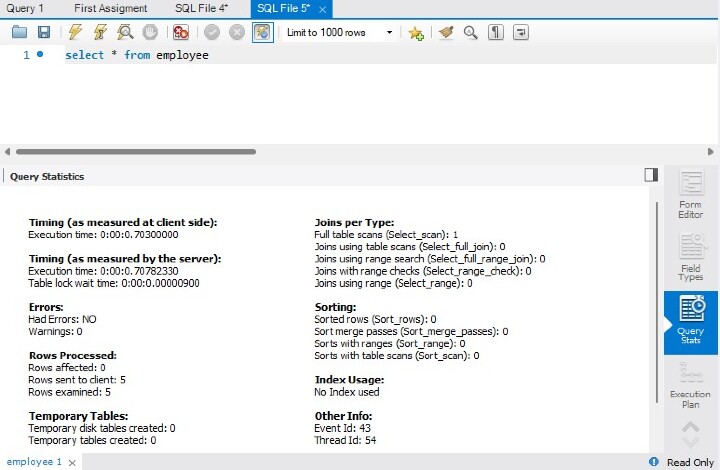
Query Statistics in MySQL
The important statistics collected for a performed query, including time, temporary tables, indexes, joins, and more, are gathered in the Query Stats SQL editor results tab (see the following two figures).
Requirements
Enabled query, and collect performance schema statistics.
The performance_schema has statement instrumentation enabled.
SQL Editor: Query Stats
Visual Explain Plan
By utilizing the additional data included in the enhanced JSON format, the visual explain feature creates and presents a visual depiction of the MySQL EXPLAIN statement. All EXPLAIN formats, including the standard format, the raw extended JSON, and the visual query plan, are available in MySQL Workbench for executed queries.
Visually Demonstrate Use
Execute your query in the SQL editor, then choose Execution Process from the query results menu to receive a visual explanation of the execution plan. The execution plan contains a Tabular Explain view that resembles what you see when you run EXPLAIN in the MySQL client in addition to the Visual Explain view, which is the default. See Optimizing Queries with EXPLAIN for details on how MySQL executes statements.
Visual Explain Conventions
A visual explanation diagram should be read from bottom to top and from left to right. An overview of the graphic, textual, and informational conventions used to represent various elements of the visual explanation plans is given in the diagram examples that follow. To learn more details, see ?
Graphic Standards
Informational and Textual Conventions
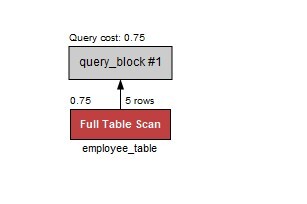
The first figure's visual explain diagram provides a visual depiction of the following query.
select * FROM employee_table
A Visual Explain Example
Graphic Conventions
Standard Boxes: tables
Rounded boxes: operations such as GROUP and SORT
Framed boxes: subqueries
Diamonds: joins
Textual and Informational Conventions
Standard text below boxes: table (or alias) name
Bold text below boxes: key/index that was used
Number in top right of a box: number of rows used from the table after filtering
Number in top left of a box: relative cost of accessing that table (requires MySQL 5.7 or higher)
Number to the right of nested loop (or hash join) diamonds: number of rows produced by the JOIN
Number above the diamonds: relative cost of the JOIN (requires MySQL 5.7 or higher)
The following table shows the associated colors and descriptions used in the visual explain diagram. For more information about cost estimates, see The Optimizer Cost Model.
Visual Explain Diagram Information
System Name |
Color |
Text on Visual Diagram |
Tooltip Related Information |
|---|---|---|---|
SYSTEM |
Blue |
Single row: system constant |
Very low cost |
CONST |
Blue |
Single row: constant |
Very low cost |
EQ_REF |
Green |
Unique Key Lookup |
Low cost -- The optimizer is able to find an index that it can use to retrieve the required records. It is fast because the index search directly leads to the page with all the row data |
REF |
Green |
Non-Unique Key Lookup |
Low-medium -- Low if the number of matching rows is small; higher as the number of rows increases |
FULLTEXT |
Yellow |
Fulltext Index Search |
Specialized FULLTEXT search. Low -- for this specialized search requirement |
REF_OR_NULL |
Green |
Key Lookup + Fetch NULL Values |
Low-medium -- if the number of matching rows is small; higher as the number of rows increases |
INDEX_MERGE |
Green |
Index Merge |
Medium -- look for a better index selection in the query to improve performance |
UNIQUE_SUBQUERY |
Orange |
Unique Key Lookup into table of subquery |
Low -- Used for efficient Subquery processing |
INDEX_SUBQUERY |
Orange |
Non-Unique Key Lookup into table of subquery |
Low -- Used for efficient Subquery processing |
RANGE |
Orange |
Index Range Scan |
Medium -- partial index scan |
INDEX |
Red |
Full Index Scan |
High -- especially for large indexes |
ALL |
Red |
Full Table Scan |
Very High ? very costly for large tables, but less of an impact for small ones. No usable indexes were found for the table, which forces the optimizer to search every row. This could also mean that the search range is so broad that the index would be useless. |
UNKNOWN |
Black |
unknown |
Note: This is the default, in case a match cannot be determined |
Conclusion
In this article, we learned how to get Query stats in MySQL workbench and what are different characteristics of it are at same time.

2K+ Views
