- CatBoost - Home
- CatBoost - Overview
- CatBoost - Architecture
- CatBoost - Installation
- CatBoost - Features
- CatBoost - Decision Trees
- CatBoost - Boosting Process
- CatBoost - Core Parameters
- CatBoost - Data Preprocessing
- CatBoost - Handling Categorical Features
- CatBoost - Handling Missing Values
- CatBoost - Classifier
- CatBoost - Model Training
- CatBoost - Metrics for Model Evaluation
- CatBoost - Classification Metrics
- CatBoost - Over-fitting Detection
- CatBoost vs Other Boosting Algorithms
- CatBoost Useful Resources
- CatBoost - Quick Guide
- CatBoost - Useful Resources
- CatBoost - Discussion
CatBoost - Quick Guide
CatBoost - Overview
CatBoost is a machine learning tool which is created by Yandex, a Russian multinational technology company. It allows computers to learn from data and make reliable conclusions or predictions. "CatBoost" stands for "Category Boosting." It can handle both numbers and categories.
CatBoost can be used by anyone, no matter their level of machine learning skill. It can be used for a number of tasks, like price estimation, pattern detection, and gaming. CatBoost offers detailed documentation and examples, which makes it easy to understand and use.
How CatBoost Works?
CatBoost uses a technique called "Gradient Boosting." It builds a series of little decision trees that gradually enhance predictions. Focusing on issues from previous stages creates a powerful final model.
In short, CatBoost is a powerful, fast, and easy to use machine learning tool that can be applied to a wide range of data and problems.
CatBoost Key Properties
Here are some common properties of the CatBoost −
Manages different Data Types CatBoost works well with both numerical and categorical data types.
Fast and Efficient It is faster and more efficient, which makes it ideal for big companies.
Less Manual work needed CatBoost needs less manual work than other tools. This means you will not have to spend much time getting your data ready.
Prevents Over-fitting Over-fitting occurs when a model learns too much from training data and fails to perform well on new data. CatBoost lowers Over-fitting, which enhances prediction accuracy.
CatBoost History
Yandex, a well-known Russian information technology company, created CatBoost in 2017. Yandex wanted to create a machine learning platform that is capable of handling all types of data, including categorical data, with ease.
Before CatBoost, most machine-learning algorithms struggled with categorical data. CatBoost was designed to handle these data types more effectively, making it a valuable resource for many organizations and researchers.
Yandex released CatBoost as open-source software in 2017. This shows that anyone can use, study, and improve it. CatBoost's open-source nature helped its rapid growth, as many members of the machine learning community started using and contributing to it.
CatBoost gained popularity because of its speed and accuracy. It additionally has several unique characteristics, like as handling missing data and preventing Over-fitting.
Advantages of CatBoost
Here are the main advantages of using CatBoost −
CatBoost is specifically designed to operate with categorical data (e.g., colors, names, or categories) without needing much human preparation.
CatBoost frequently makes accurate predictions because it learns from data step by step, fixing errors as it proceeds.
It performs well with large data sets, saving time and resource usage.
CatBoost prevents Over-fitting, so it works well with both historical and new data.
It has a simple setup and takes less time to prepare data, which makes it suitable for beginners.
Disadvantages of CatBoost
Below are some drawbacks of CatBoost you should consider while using it −
CatBoost can be memory-intensive, particularly when dealing with large datasets.
CatBoost is fast, but training may take longer if the dataset is very large or complex.
CatBoost has a smaller user base than earlier products like XGBoost, so there can be fewer tutorials or examples available online.
While it is simple to use for basic tasks, using additional features can be complex and can require a deeper understanding of machine learning.
CatBoost may not be the ideal choice for highly specialized machine learning jobs.
When to Use CatBoost
Use CatBoost if you have data with a mix of numbers and categories, need high accuracy, want to avoid Over-fitting, have large datasets, or want to save time on data preparation. It helps for a number of real-world applications and industries that require speedy and precise predictions.
Use Cases for CatBoost
Here are some use cases where you can use CatBoost −
Based on data like purchase history and preferences, it predicts which customers will buy, depart, or respond to offers.
Credit scoring allows banks to decide whether or not to make a loan based on credit history, income, and other factors.
Detects suspicious activity in payments to help prevent fraud, like unauthorized credit card use.
Medical data analysis predicts patient outcomes like disease risk and therapy performance.
Sales forecasting predicts future sales trends, which allows organizations to plan more effectively.
Recommendation systems suggest things or information based on user preferences and behavior.
CatBoost - Architecture
CatBoost is a machine learning program that generates data−driven predictions. The name "CatBoost" comes from two words: "categorical" and "boosting."
- Categorical data is data that can be divided into categories, like colors (red, blue, green) or animal types (cat, dog, bird).
- Boosting is a machine learning technique that combines several simple models to produce a more robust and accurate model.
Architecture of CatBoost
CatBoost Architecture refers to the CatBoost tool's ability to produce data-driven predictions. CatBoost is based on a system of machine learning known as decision trees.
A decision tree works like a flowchart, making decisions depending on the information it receives. Each "branch" of the tree represents a decision, and each "leaf" indicates the outcome.
CatBoost uses a unique method known as "boosting," which combines multiple small decision trees into a single strong model. Each new tree corrects errors in previous trees, boosting the model's accuracy over time.
Key Components
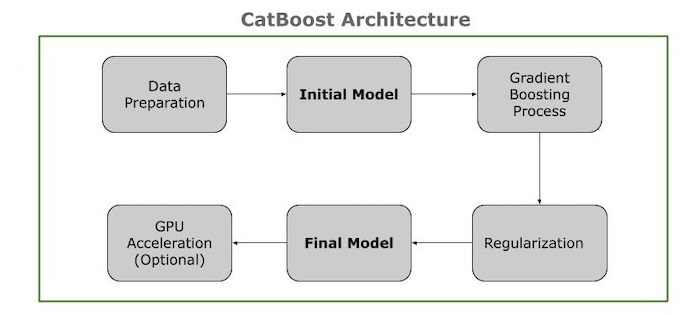
The CatBoost architecture shows its major components and interconnections. This is an overview of the architecture's components −
Data Preparation Contains categories and numerical features, as well as target values. Dealing with missing values, standardizing data, etc. Transform categorical features into target−based encoding.
Initial Model Then you have to calculate an initial prediction and this is often the average goal value.
Gradient Boosting Process Next you need to calculate the difference between the actual and predicted values. And train with only past data (ordered boosting) to generate consistent partitions (symmetric trees). Then iInsert the tree into the model, adjust the residuals, and repeat until the performance is stable or the tree count is reached.
Regularization In this process you need to add a penalty to prevent Over-fitting and reduce model complexity.
Final Model In this phase you need to combine all decision trees to form the final model. And use the finished model to predict the effects of new data.
GPU Acceleration Uses GPUs to speed up computations, particularly on large datasets.
Mathematical Representation
CatBoost requires a function F(x) to predict the target variable y given a training dataset of N samples and M features. Each sample is indicated as (xi, yi), with xi is a vector of M features and yi is a corresponding target variable.
CatBoost generates various decision trees. Each tree generates a prediction, and estimates are merged for better accuracy.
F(x) = F0(x) + ∑Mm=1 fm(x)
Here −
F(x) is the final prediction.
F0(x) is the initial guess.
∑Mm=1 fm(x) is the sum of predictions from each tree.
The tree fm(x) predicts all samples in the dataset. For example, a single tree may know how likely a person is to buy a product.
Summary
To summarize, CatBoost is a powerful and user-friendly gradient boosting toolkit ideal for a number of applications. Whether you are a beginner looking for an easy method for machine learning or an experienced practitioner looking for the best performance, CatBoost is a valuable tool to have in your toolbox. But as with any tool, its success is determined on the specific problem and dataset, therefore it is always a good idea to experiment with it and compare it to other methods.
CatBoost - Installation
CatBoost is very fast, scalable and an open source gradient-boosting on decision trees library from Yandex. Installing CatBoost can be done in different ways as per your operating system and development environment. In this chapter we are providing different ways to install CatBoost in your system. Here are some common methods:
Using pip (for Python)
This is the most common and simple eay to install CatBoost in your system. You can follow the below command on your terminal and it will download the library and install it in the system with its dependencies.
Open your command line or terminal and run the below command −
pip install catboost
Here is the process after running the above command on terminal or command prompt −
Collecting catboost
  Downloading catboost-1.2.7-cp312-cp312-macosx_11_0_universal2.whl.metadata (1.2 kB)
Requirement already satisfied: graphviz in /Library/Frameworks/Python.framework/Versions/3.12/lib/python3.12/site-packages (from catboost) (0.20.3)
Requirement already satisfied: matplotlib in /Library/Frameworks/Python.framework/Versions/3.12/lib/python3.12/site-packages (from catboost) (3.9.2)
Collecting numpy=1.16.0 (from catboost)
  Downloading numpy-1.26.4-cp312-cp312-macosx_11_0_arm64.whl.metadata (61 kB)
      61.1/61.1 kB 1.9 MB/s eta 0:00:00
Requirement already satisfied: pandas>=0.24 in /Library/Frameworks/Python.framework/Versions/3.12/lib/python3.12/site-packages (from catboost) (2.2.2)
Requirement already satisfied: scipy in /Library/Frameworks/Python.framework/Versions/3.12/lib/python3.12/site-packages (from catboost) (1.14.1)
Collecting plotly (from catboost)
  Downloading plotly-5.24.1-py3-none-any.whl.metadata (7.3 kB)
Requirement already satisfied: six in /Library/Frameworks/Python.framework/Versions/3.12/lib/python3.12/site-packages (from catboost) (1.16.0)
Requirement already satisfied: python-dateutil>=2.8.2 in /Library/Frameworks/Python.framework/Versions/3.12/lib/python3.12/site-packages (from pandas>=0.24->catboost) (2.8.2)
Requirement already satisfied: pytz>=2020.1 in /Library/Frameworks/Python.framework/Versions/3.12/lib/python3.12/site-packages (from pandas>=0.24->catboost) (2024.1)
Requirement already satisfied: tzdata>=2022.7 in /Library/Frameworks/Python.framework/Versions/3.12/lib/python3.12/site-packages (from pandas>=0.24->catboost) (2023.4)
Requirement already satisfied: contourpy>=1.0.1 in /Library/Frameworks/Python.framework/Versions/3.12/lib/python3.12/site-packages (from matplotlib->catboost) (1.3.0)
Requirement already satisfied: cycler>=0.10 in /Library/Frameworks/Python.framework/Versions/3.12/lib/python3.12/site-packages (from matplotlib->catboost) (0.12.1)
Requirement already satisfied: fonttools>=4.22.0 in /Library/Frameworks/Python.framework/Versions/3.12/lib/python3.12/site-packages (from matplotlib->catboost) (4.53.1)
Requirement already satisfied: kiwisolver>=1.3.1 in /Library/Frameworks/Python.framework/Versions/3.12/lib/python3.12/site-packages (from matplotlib->catboost) (1.4.7)
Requirement already satisfied: packaging>=20.0 in /Library/Frameworks/Python.framework/Versions/3.12/lib/python3.12/site-packages (from matplotlib->catboost) (24.1)
Requirement already satisfied: pillow>=8 in /Library/Frameworks/Python.framework/Versions/3.12/lib/python3.12/site-packages (from matplotlib->catboost) (10.3.0)
Requirement already satisfied: pyparsing>=2.3.1 in /Library/Frameworks/Python.framework/Versions/3.12/lib/python3.12/site-packages (from matplotlib->catboost) (3.1.4)
Collecting tenacity>=6.2.0 (from plotly->catboost)
  Downloading tenacity-9.0.0-py3-none-any.whl.metadata (1.2 kB)
Downloading catboost-1.2.7-cp312-cp312-macosx_11_0_universal2.whl (27.0 MB)
    27.0/27.0 MB 4.7 MB/s eta 0:00:0000:0100:01
Downloading numpy-1.26.4-cp312-cp312-macosx_11_0_arm64.whl (13.7 MB)
    13.7/13.7 MB 3.6 MB/s eta 0:00:0000:0100:01
Downloading plotly-5.24.1-py3-none-any.whl (19.1 MB)
    19.1/19.1 MB 4.7 MB/s eta 0:00:0000:0100:01
Downloading tenacity-9.0.0-py3-none-any.whl (28 kB)
Installing collected packages: tenacity, numpy, plotly, catboost
  Attempting uninstall: numpy
    Found existing installation: numpy 2.1.1
    Uninstalling numpy-2.1.1:
      Successfully uninstalled numpy-2.1.1
Successfully installed catboost-1.2.7 numpy-1.26.4 plotly-5.24.1 tenacity-9.0.0

[notice] A new release of pip is available: 24.0 -> 24.2
[notice] To update, run: pip install --upgrade pip
Note: you may need to restart the kernel to use updated packages.
Using Conda (for Anaconda users)
If you are working with Anaconda or Miniconda then you can install CatBoost using Conda. When you run the below command it will download the necessary package and dependencies and install it in your system.
conda install -c conda-forge catboost
The terminal output would typically look like this −
(base) $ conda install -c conda-forge catboost
Collecting package metadata (current_repodata.json): done
Solving environment: done
## Package Plan ##
  environment location: /path/to/conda/environment
  added / updated specs:
    - catboost

The following packages will be downloaded:

    package                       |            build
    ------------------------------|-----------------
    catboost-1.1                   |   py38h9b699db_0   16.0 MB
    libcxx-11.1.0                  |       habf9029_0    1.3 MB
    libgfortran-5.4.0              |       h6c81a4c_10   2.2 MB
    openmp-4.5                     |       h44a4d74_1    3.1 MB
    ------------------------------------------------------------
                                           Total:   22.6 MB

The following NEW packages will be INSTALLED:

  catboost           conda-forge/osx-64::catboost-1.1-py38h9b699db_0
  libcxx             conda-forge/osx-64::libcxx-11.1.0-habf9029_0
  libgfortran        conda-forge/osx-64::libgfortran-5.4.0-h6c81a4c_10
  openmp             conda-forge/osx-64::openmp-4.5-h44a4d74_1

Proceed ([y]/n)? y

Downloading and Extracting Packages
catboost-1.1         |  16.0 MB | ########## | 100%
libcxx-11.1.0        |   1.3 MB | ########## | 100%
libgfortran-5.4.0    |   2.2 MB | ########## | 100%
openmp-4.5           |   3.1 MB | ########## | 100%
Preparing transaction: done
Verifying transaction: done
Executing transaction: done
Building from Source
If you are an advanced user then you can build CatBoost from the source code if you want the latest version. So install CMake, Git, Python, and other build tools needed for your system. First you need to clone the CatBoost repository −
git clone https://github.com/catboost/catboost.git
Here is the terminal output −
$ git clone https://github.com/catboost/catboost.git
Cloning into 'catboost'...
remote: Enumerating objects: 345600, done.
remote: Counting objects: 100% (2147/2147), done.
remote: Compressing objects: 100% (1098/1098), done.
remote: Total 345600 (delta 1345), reused 1623 (delta 1019), pack-reused 343453
Receiving objects: 100% (345600/345600), 297.60 MiB | 5.50 MiB/s, done.
Resolving deltas: 100% (266248/266248), done.
After running the above command you have to navigate to the cloned directory −
cd catboost
Then build the project like below −
./ya make -r -DUSE_SYSTEM_PYTHON=1 catboost/python-package
The terminal output is as follows −
$ ./ya make -r -DUSE_SYSTEM_PYTHON=1 catboost/python-package
Configuring the build...
[INFO] [18:34:56] Project configuration complete
[INFO] [18:34:57] Building CatBoost package...
[INFO] [18:34:58] Running CMake...
[INFO] [18:35:02] Generating build system...
[INFO] [18:35:03] Build started...
[ 10%] Building CXX object contrib/libs/oblivious_tree/CMakeFiles/oblivious_tree.dir/tree.cpp.o
[ 20%] Building CXX object contrib/libs/model/CMakeFiles/model.dir/model.cpp.o
[ 30%] Linking CXX static library libcatboostmodel.a
[ 40%] Building wheel for Python package
[ 60%] Linking CXX shared library libcatboost.so
[ 80%] Generating Python bindings...
[100%] Completed successfully
And lastly Install the package −
cd catboost/python-package
pip install .
Here is the output for the above command after installing the package −
$ pip install .
Processing /path/to/catboost/python-package
  Preparing metadata (setup.py) ... done
Requirement already satisfied: numpy in /path/to/conda/env/lib/python3.8/site-packages (from catboost==1.1) (1.20.0)
Requirement already satisfied: six in /path/to/conda/env/lib/python3.8/site-packages (from catboost==1.1) (1.15.0)
Building wheels for collected packages: catboost
  Building wheel for catboost (setup.py) ... done
  Created wheel for catboost: filename=catboost-1.1-cp38-cp38-linux_x86_64.whl size=1234567
  Stored in directory: /tmp/pip-ephem-wheel-cache-abcd1234
Successfully built catboost
Installing collected packages: catboost
Successfully installed catboost-1.1
Installing for R
If you want to use R programming language then you can install CatBoost for R using the below command. To run the command you just need to open R console or RStudio and then run the command −
install.packages('catboost', repos = 'https://cloud.r-project.org/', dependencies=TRUE)
So the command will install CatBoost for R programming.
CatBoost - Features
CatBoost is a type of gradient boosting and it can handle both categorical and numerical data. It also works well with minimal effort from the user. It does not need any feature encoding methods, like One-Hot Encoder or Label Encoder to transform category features to numerical ones.
It also uses the symmetric weighted quantile sketch (SWQS) algorithm, which is used to manage missing values in the dataset automatically in order to prevent over-fitting and improve overall dataset performance.
In this chapter we will discuss the key features, as well as examples to help you understand.
Great quality without parameter tuning
CatBoost works effectively out of the box, so you need not spend a lot of time adjusting its settings or hyper-parameters to get remarkable outcomes. This saves a huge amount of time, as selecting the right parameters in machine learning is often complex and time-consuming.
Example: Let's suppose you are building a model to predict values of houses. Many methods need hours or even days of parameter adjustments to improve model performance. So the default settings of CatBoost give excellent results so you do not have to worry of doing any extra work.
Supports categorical features (non-numeric data)
CatBoost can handle non-numerical data with minimal preprocessing like as words or categories. Most machine learning algorithms need numbers to function, so you will have to convert text data to numbers. CatBoost performs this automatically, which saves time and work.
Example: Let us say you are creating a model which is used to predict a success of a product as per its color for example red, blue, or green. Many algorithms will ask you to convert these colors into numbers first. CatBoost handles this for you, making things easier.
Fast and scalable GPU version
CatBoost can work with GPUs (Graphics Processing Units), which somewhat improves it, particularly for large datasets. GPUs outperform traditional CPUs (Central Processing Units) in terms of handling several calculations at once. If you have a large dataset then the speed is even more important.
Example: Let us suppose that you are training a model with millions of rows on a large dataset. If you use a CPU, it can take a few days or even hours. But with the help of CatBoost on a GPU, the same training can be done much faster, in a fraction of the time.
Improved accuracy
CatBoost has a smart learning approach that helps to reduce over-fitting, which occurs when a model becomes overly focused on training data and fails to perform well on new, unknown data. This improves the CatBoost models' accuracy when predicting new data.
Example: Assume you are building a model to predict the popularity of a new song. If your model is too much dependent on training data, it can under perform on new songs. CatBoost's technique helps to avoid this problem, making sure your model performs well with new data.
Fast Prediction
CatBoost learns and predicts faster compared to all other algorithms. It can use several GPUs to learn more quickly, which improves its capacity to predict new outcomes. In some cases, it is 13-16 times faster than traditional machine learning algorithms.
Example: Assume you are building a recommendation system that recommends items to users while they browse an online store. CatBoost allows the system to make fast recommendations in real time, meaning that users get suggestions without having to wait.
CatBoost - Decision Trees
Decision trees are a main part or component of machine learning mainly for classification and regression applications. It works by breaking down the feature space into smaller parts as per the set of rules which creates a tree-like structure with each internal node having a feature-based decision and each leaf node giving the output label or value.
On the other hand, Boosting is a process of ensemble learning that particularly combines multiple weak learners means decision trees to create a strong learner. It mainly focuses on training new models to improve the previous errors which modifies overall predictive performance. Below is the visualization of CatBoost Decision Tree −

Let us see how the tree grows in CatBoost −
Depth-Wise Tree Growth
Depth-wise tree development is also known as level-wise or breadth-first growth. So as name suggests it involves growing trees horizontally until they reach an allocated maximum depth. At each level, the algorithm examines all nodes in the tree and divides them to create new nodes for the next level.
Characteristics of Depth-wise Tree
Here are the characteristics of Depth-Wise tree −
Balanced Tree Growth: To keeps the trees balanced, it grows by splitting at each level (depth by depth). Before going on to the next level each level of the tree is fully established.
Leaf Splitting: CatBoost examines all alternative split at each depth before choosing the best one. It tries to split multiple leaves in each iteration compared to other methods, which only split one at a time.
Efficient Handling of High Dimensions: For maintaining balance the trees will get separated at each level (depth by depth). Each level of the tree is completely set up before proceeding to the next level.
Control Over Depth: CatBoost compares all alternate splits at each depth before selecting the best one. It splits multiple leaves in each iteration, unlike other methods that only split one at a time.
Parallelization: CatBoost's depthwise tree structure allows efficient parallel processing, which leads to more efficient computations, specially for large datasets.
Leaf-Wise Tree Growth
Leaf-wise tree growth is also known as best first or greedy growth. It basically expands trees by dividing them on the most optimal feature and leaf at every step. It selects the best split in all possible splits so the result will be a tree structure with deep branches as compared to depth-wise tree growth.
Characteristics of Leaf-Wise Tree
Here are some characteristics given for leaf-wise tree −
Instead of growing the tree level by level, the algorithm chooses the leaf with the highest error to split next. This method focuses the algorithm on areas with low accuracy and improves them first.
Unlike depthwise growth, leafwise growth can lead to unbalanced trees. Some branches can go deeper than others since the algorithm divides leaves based on where the most loss happens.
By splitting the leaves that contribute the most to the error, the method instantly decreases the overall prediction error. Leaf-wise trees are therefore effective in fitting complex patterns to data.
Because of its ability to grow deeply on some branches, the tree may exceed the training set. Regularization techniques and hyperparameters such as max_depth or l2_leaf_reg can be used to control the maximum depth of the tree so that reducing overfitting.
The growth of the tree is not as balanced or predictable as depth-wise trees, but it can make it more flexible in some cases.
Role of Decision Trees in CatBoost
Decision trees are a key component of many machine learning algorithms, like CatBoost. These are predictive models that use a graph that looks like a tree to map decisions and possible results. In the CatBoost framework, decision trees work as base learners, giving the boosting process a structure.
Using a technique called gradient boosting, CatBoost builds decision trees one after the other to correct errors made by previous trees. As the name "Cat" suggests "categorical," CatBoost is a gradient boosting version that performs better than earlier methods at handling categorical features.
CatBoost - Boosting Process
CatBoost (short for "Categorical Boosting") is just like other gradient boosting methods like XGBoost or LightGBM, but it has some notable benefits, mainly when working with categorical data.
Key Steps in CatBoost Boosting Process
So let us discuss the key features of CatBoost boosting process −
- Data Preparation: CatBoost automatically converts categorical features into numerical values using target statistics. This maximizes the efficiency of the datasets with a high number of categorical variables.
- Model Initialization: A basic model, usually the average of the regression target variable, is the first step in the CatBoost process.
- Gradient Calculation: At every step, this method finds the gradient of the loss function. Loss function is the difference between the expected and actual values. This gradient gives the starting point for building the decision tree.
- Decision Tree Construction: CatBoost uses a symmetric tree structure in which each level of the trees has the same amount of nodes. This way we can speed up the process and improves forecast time.
- Ordered Boosting: One of unique characteristics of CatBoost is ordered boosting. Conventional boosting methods have the risk of overfitting on the training set as they calculates errors with the help of the entire dataset. But CatBoost do this by using a technique that lowers the possibility of overfitting by only using a subset of data.
- Model Updating: The predictions of the previous trees are contributed to the new tree when it is added to the ensemble, updating the predictions it creates.
- Repeat: The process is repeated until the model's performance on the validation dataset stops improving, or for the pre-specified number of iterations.
Benefits of CatBoost Boosting Process
Here are the advantages of CatBoost boosting process you should know while working with it −
Effective Management of Categorical Features: Unlike previous methods, CatBoost does not need one-hot encoding or extensive feature engineering for handling categorical features.
Better Performance: CatBoost generally works better on many types of data mainly when there are a lot of categories like colors or names. This is because it uses ordered boosting and other helpful methods.
Summary
CatBoost builds decision trees step by step to make better predictions. It is very good with data that has categories, like colors or names. It uses special methods like ordered boosting and target encoding to stop the model from making mistakes by learning too much from the training data. This helps the model work well with new data.
CatBoost - Core Parameters
CatBoost is an very useful machine learning library which is created for applications which needs categorization and regression. And you can use the code parameters to fit your dataset and the specific problem you are working on. Also to improve your model's accuracy, avoid overfitting and speed training you should use these parameters in your model.
Core Parameters
Core parameters in CatBoost are the main configurations that have a major effect on the behavior and functioning fo your model. Besides other things, these parameters control the number of training iterations, learning rate, tree depth, and loss function in the overall training process.
There are many parameters you can control while using CatBoost. Here are some core parameters listed below −
Key Parameters
The internal settings of the model that it learns at the time of training are known as the common parameters. Such as the split points and leaf values in a decision tree are parameters. The training process of CatBoost can be set by modifying a number of settings. Let us look at some important CatBoost parameters and their functions −
iterations: It is the number of times the increment is given. A new model is added to the ensemble with every iteration.
learning_rate: It is the degree of improvement at each iteration. So a lower learning rate means more constant but possibly delayed convergence.
depth: It is the maximum depth of a tree. A deeper tree allows for more complex connections but it can also overfit.
loss_function: This loss function is used to evaluate how well the model performed at the time of training. Common choices are RMSE for regression, CrossEntropy for multi-class classification, and Logloss for binary classification.
eval_metric: It is the performance metric of model used at the time of training.
random_seed: It is a random seed to make sure repetition.
Common Parameters
Here are the common parameters listed, mainly used for the Python package, R package and Command-line version −
1. loss_function:
It is mainly used to decide what kind of problem you are solving for example, classification or regression and which metric to optimize. To use this parameter you can set it to values like 'Logloss' for classification or 'RMSE' for regression.
Command Line −
--loss-function
2. custom_metric:
Using custom_metric you can monitor extra metrics at the time of training. These metrics are used for your information and not for optimizing the model. To use this parameter you need to list metrics that you want to track but these will not affect overall model performance.
Command Line −
--custom-metric
3. eval_metric
It is used for checking how the model is working at the time of training and to find overfitting. This metric helps to pick the best model. To use this you can choose a metric that fits your problem like 'Accuracy' for classification.
Command Line −
--eval-metric
4. iterations:
This parameter sets the number of trees (iterations) CatBoost will build. More iterations can improve accuracy but may increase training time.
Command Line −
-i, --iterations
5. learning_rate:
The learning rate controls how fast or slow the model learns. A smaller value results in better accuracy but requires more iterations.
Command Line −
-w, --learning-rate
6. random_seed:
It ensures the same results every time you train the model by fixing the random seed value.
Command Line −
-r, --random-seed
7. l2_leaf_reg:
This parameter adds L2 regularization to prevent overfitting. By increasing this value it can help reduce overfitting.
Command Line −
--l2-leaf-reg
8. bootstrap_type:
Defines the method for sampling the weights of objects during training. Options include 'Bayesian', 'Bernoulli', etc.
Command Line −
--bootstrap-type
9. bagging_temperature:
This adjusts the amount of randomness in data sampling during training. A higher value adds more randomness.
Command Line −
--bagging-temperature
10. subsample:
This parameter controls the percentage of data used for training each tree. A value below 1 uses only a fraction of the data.
Command Line −
--subsample
11. depth:
The depth of the tree determines how complex the model is. Deeper trees can model more complex patterns but may lead to overfitting.
Command Line −
-n, --depth
12. grow_policy:
Defines the strategy for growing trees. Different policies can be chosen based on the problem and dataset.
Command Line −
--grow-policy
13. min_data_in_leaf:
This sets the minimum number of data points that must be present in a leaf. It helps avoid overfitting by preventing splits on small samples.
Command Line −
--min-data-in-leaf
14. max_leaves:
This parameter controls the maximum number of leaves in a tree. It is only used with specific tree-growing policies.
Command Line −
--max-leaves
15. ignored_features:
You can exclude certain features from the model by specifying their indices or names. This is useful if some features are not relevant.
Command Line −
-I, --ignore-features
16. one_hot_max_size:
This parameter applies one-hot encoding to categorical features with a small number of unique values (below the specified limit).
Command Line −
--one-hot-max-size
17. class_weights:
This parameter allows you to assign different weights to different classes, especially useful when the data is imbalanced (one class has far fewer examples).
Command Line −
--class-weights
CatBoost Example using Common Parameters
Here is an example of how to build a CatBoost model using a few of the commonly used parameters. This Python code example shows how to use these parameters −
# Import the necessary libraries
from catboost import CatBoostClassifier
from sklearn.model_selection import train_test_split
from sklearn.datasets import load_iris
from sklearn.metrics import accuracy_score

# Load the Iris dataset as an example
data = load_iris()
X = data['data']
y = data['target']

# Split the data into training and testing sets
X_train, X_test, y_train, y_test = train_test_split(X, y, test_size=0.2, random_state=42)

# Initialize CatBoostClassifier with common parameters
model = CatBoostClassifier(
   # Number of trees
   iterations=100,
   # Learning rate
   learning_rate=0.1,
   # Depth of the trees
   depth=6,
   # Loss function for multi-class classification
   loss_function='MultiClass',
   # Metric for evaluating performance
   eval_metric='Accuracy',
   # Random seed for reproducibility
   random_seed=42,
   # L2 regularization to prevent overfitting
   l2_leaf_reg=3.0,
   # Bootstrap method for bagging
   bootstrap_type='Bernoulli',
   # Silent mode, no training output
   verbose=False
)

# Train the model
model.fit(X_train, y_train, eval_set=(X_test, y_test))

# Make predictions
y_pred = model.predict(X_test)

# Evaluate the model
accuracy = accuracy_score(y_test, y_pred)
print(f'Accuracy: {accuracy:.4f}')
Output
This will generate the below result:
Accuracy: 1.0000
CatBoost - Data Preprocessing
CatBoost data preprocessing involves handling of categorical features and minimizing memory usage in order to prepare data for training. Categorical variables may not need any manual preprocessing processes just like one-hot encoding, as they can be handled automatically. CatBoost increases data preparation by allowing it to operate directly with missing values.
Data handling for training and prediction is made simpler and better by using a CatBoost pool that provides the dataset with features, labels, and categorical feature index. CatBoost simplifies the machine learning workflow by maintaining high prediction performance and reducing data preprocessing. So it allows users to focus more on model construction and optimization.
Why Data Preprocessing in CatBoost?
CatBoost simplifies data preprocessing for the below reasons −
CatBoost can work directly with categorical features without the need for manual encoding. Just like one-hot encoding. This property saves time and minimize the complexity of the model.
The catboost technique is used to handle missing values automatically which can save you to make an effort of putting them in before the model is trained.
CatBoost may not ask you to scale your features in the same manner that normalization or classification does unlike other boosting methods. This tool makes preprocessing very easy.
By using different data sections in training, CatBoost provides methods that reduce over-fitting.
Preprocessing can be used to manage large datasets with a lot of features.
The CatBoost library was created to be easy to use with clear documentation and basic APIs. Because of this functionality both experts and beginners can use it.
Steps for Preprocessing
Here are a simple steps of data preprocessing for CatBoost −
-
Step 1: Install CatBoost: First you need to make sure that you have CatBoost installed. You can install it by using the below command:
pip install catboost
Step 2: Prepare Your Data − Now you have to prepare your data and your data should be in a structured format, like a pandas DataFrame.
Step 3: Identify Categorical Features − Now list the columns that are categorical. So that the CatBoost library can automatically handle them, but you should specify them.
Step 4: Encode Categorical Features − You do not need to manually encode categorical features because CatBoost can take them automatically. But be careful while defining which feature is categorical.
-
Step 5: Split Your Data −Then you can divide your data into the training and testing sets. This process will help you to evaluate the model in next stages.
from sklearn.model_selection import train_test_split
X_train, X_test, y_train, y_test = train_test_split(X, y, test_size=0.2, random_state=42)
-
Step 6: Create a Pool − CatBoost makes use of a special data structure which is called a 'Pool' for training. You can create it like the below:
from catboost import Pool

train_pool = Pool(X_train, y_train, cat_features=categorical_features)
test_pool = Pool(X_test, y_test, cat_features=categorical_features)
-
Step 7: Train the Model − Now with the help of your prepared data, you can train the model:
from catboost import CatBoostClassifier

model = CatBoostClassifier(iterations=1000, learning_rate=0.1, depth=6)
model.fit(train_pool)
-
Step 8: Make Predictions − Predictions can be done by using the model to the test set::
predictions = model.predict(test_pool)
Step 9: Evaluate the Model − Finally, you can use measures like accuracy or F1 score to evaluate the way your model performs.
CatBoost - Handling Categorical Features
Categorical features are variables that represent categories or labels rather than numerical values, so they are sometimes referred to as nominal or discrete features. These features are common in a wide range of real-world datasets and can be difficult to include into machine learning models.
We can classify categories into two main types −
Nominal Categorical features: These features represent categories with no basic order or ranking, like color, gender, and country. These features typically need special encoding, like Label encoding to be used in machine learning models.
Ordinal Categorical Features: These features represent categories having a meaningful order or ranking, like education level with categories such as high school, bachelor's degree, master's degree, and so on. These features can be written as integer numbers to show their order.
CatBoost Parameters
CatBoost is an advanced gradient boosting library that includes a huge number of parameters for changing and refining models. Let us have a look at some of the most commonly used CatBoost parameters −
learning_rate: As the loss function approaches its minimum, the step size is adjusted at each iteration. But it needs more iterations, a slower learning rate enhances training. The most common values range between 0.01 and 0.3.
iterations: It shows the total number of ensemble tree or boosting iterations. More iterations can boost model performance but they increase the possibility of overfitting. A few hundred to a few thousand is an average range.
l2_leaf_reg: It is the he weighted L2 regularization. Penalizing heavy weights on features helps to reduce overfitting. Adjusting this value improves regularization.
depth: It refers to the overall number of trees in the ensemble. It defines the level of complexity in each tree. While deeper trees can describe complicated relationships, they are more prone to overfitting. Values often vary between 4 and 10.
verbose: When set to True, it displays the training progress during iterations. If False, it works silently and does not print progress.
random_seed: It is the seed used by the random number generator. Setting this value ensures the reproducibility of the results.
one_hot_max_size: The maximum number of distinct categories that one-hot encoding of a categorical feature can support. CatBoost uses an effective approach to handle the feature differently if the number of unique categories exceeds this limit.
cat_features: A set of indices representing category features. CatBoost encodes these features for training purposes and handles them differently.
CatBoost with Categorical Features
Unlike many other machine learning models in which the categorical variables or features need to be manually encoded but CatBoost can handle categorical features directly. You just have to tell which features are categorical and CatBoost will handle them. So let us see how we can implement CatBoost with categorical features −
1. Install CatBoost Library
First you have to make sure that you have installed CatBoost library or not. If it is not installed then you can install it using the below command −
pip install catboost
Import the Libraries
After installing you are ready to use it in your model. So import necessary Libraries in your code like the below −
from catboost import CatBoostClassifier, Pool
from sklearn.model_selection import train_test_split
2. Load and Prepare the Data
You have to make sure that your dataset has categorical features. As we have discussed earlier, You do not need to manually encode them.
# Sample Data
data = [
   ['red', 1, 5.1],
   ['blue', 0, 3.5],
   ['green', 1, 4.7],
   ['blue', 0, 2.9],
   ['red', 1, 5.0]
]
3. Target Values and Split the Data
Now you have to target values and then convert it into the data frame. After converting into the data frame you have to split the data into testing and training datasets to test and train the model.
# Target values
labels = [1, 0, 1, 0, 1]

# Convert to DataFrame
import pandas as pd
df = pd.DataFrame(data, columns=['color', 'feature1', 'feature2'])

# Split data into train and test sets
X_train, X_test, y_train, y_test = train_test_split(df, labels, test_size=0.2, random_state=42)
4. Identify Categorical Features
As we have seen earlier in this chapter that in CatBoost you have to tell the model which features are categorical. And this thing can be done by passing the index or name of the categorical features just like the below −
# Declare categorical features (column index or name)
categorical_features = ['color']
5. Train the Model
Now use the CatBoostClassifier or CatBoostRegressor of CatBoost for classification or regression tasks. Before doing it you have to pool object to specify the data, labels, and categorical features. See the code below −
# Pool object
train_pool = Pool(data=X_train, label=y_train, cat_features=categorical_features)
test_pool = Pool(data=X_test, label=y_test, cat_features=categorical_features)

# Initialize and train the model
model = CatBoostClassifier(iterations=100, learning_rate=0.1, depth=6)
model.fit(train_pool)

# Predict on the test set
preds = model.predict(test_pool)

# Model accuracy
accuracy = (preds == y_test).mean()
print(f"Accuracy: {accuracy}")
Output
Here is the result of the above model we have created for Categorical Features in CatBoost −
0:	learn: 0.6869753	total: 59.5ms	remaining: 5.89s
1:	learn: 0.6794071	total: 61.6ms	remaining: 3.02s
2:	learn: 0.6632128	total: 61.8ms	remaining: 2s
.
.
.
96:	learn: 0.2241489	total: 83.4ms	remaining: 2.58ms
97:	learn: 0.2228507	total: 83.5ms	remaining: 1.7ms
98:	learn: 0.2215656	total: 83.7ms	remaining: 845us
99:	learn: 0.2202937	total: 83.9ms	remaining: 0us
Accuracy: 1.0
CatBoost - Handling Missing Values
Missing values mean that some data is not available in a dataset. This can happen for different reasons, like mistakes in collecting the data or on purpose leaving out certain information. To build an accurate predictive model we have to manage them carefully. In datasets, typical missing values are represented in two ways, explained below:
NaN (Not a Number): In numeric datasets, NaN is often used to represent missing or undefined values. The IEEE standard defines NaN, a specific floating-point value that is frequently used in programming languages like Python and libraries like NumPy.
NULL or NA: In database systems and statistical software, NULL or NA can be used to identify missing values. These are just placeholders that indicate a lack of data for a particular observation.
CatBoost by Handling Missing Values
CatBoost can handle missing values on its own so you do not have to fix them yourself. Here is how it works and how to use it −
1. Install CatBoost Library
First you have to make sure that you have installed CatBoost library or not. If it is not installed then you can install it using the below command −
pip install catboost
2. Import the Libraries
After installing you can use CatBoost in your model. So import necessary Libraries like NumPy, Pandas, Matplotlib, Seaborn and SKlearn etc, in your code like the below −
import pandas as pd
import numpy as np
import seaborn as sns
import matplotlib.pyplot as plt
from catboost import CatBoostRegressor, Pool
from sklearn.metrics import mean_absolute_error, r2_score
from sklearn.model_selection import train_test_split
3. Loading the Dataset
Now we load a dataset from system directory, here we are using house prices dataset for implementing the model. Then, we will divide it into training and testing sets and prepare categorical features to provide to CatBoost during training.
# Load the dataset
data = pd.read_csv('/Python/Datasets/train.csv')
# Select features and target variable
features = data.columns.difference(['SalePrice']) # All columns except 'SalePrice'
target = 'SalePrice'

# Change categorical features to strings
categorical_features = data[features].select_dtypes(include=['object']).columns
for feature in categorical_features:
	data[feature] = data[feature].astype(str)

# Split data into features and target
X = data[features]
y = data[target]

# Split the data into training and testing datasets
X_train, X_test, y_train, y_test = train_test_split(X, y, test_size=0.2, random_state=42)

# Figure out categorical features
categorical_features_indices = np.where(X.dtypes == 'object')[0]
This code loads and prepares the House Price dataset for modeling. It converts the category data into strings. The data is then separated into two parts: features (X) and target (Y). After that, the data is separated into two sets: training (80%) and testing (20%). CatBoost uses the variable categorical_features_indices to find out which features are categorical, allowing it to properly manage them during training.
Exploratory Data Analysis
Exploratory Data Analysis (EDA) allows us to get a deeper understanding of the dataset.
Checking missing values
This is very relevant to this chapter and useful for any dataset. If missing values are not properly handled, they have an impact on the model's predictions. Here we will see which columns of our dataset have missing values and as well as the total count.
# Check for missing values
missing_values = data.isnull().sum().sort_values(ascending=False)
missing_values = missing_values[missing_values > 0]
print("\nMissing Values Columns:\n", missing_values)
Output
Here is the outcome of the model −
Missing Values Columns:
 PoolQC              1453
MiscFeature     1406
Alley                  1369
Fence                1179
FireplaceQu     690
LotFrontage      259
GarageYrBlt       81
GarageCond     81
GarageType      81
GarageFinish    81
GarageQual      81
BsmtFinType2    38
BsmtExposure   38
BsmtQual           37
BsmtCond          37
BsmtFinType1     37
MasVnrArea        8
MasVnrType         8
Electrical              1
dtype: int64
To check for missing values in the 'data' DataFrame this code sums the null values for each column. The columns are then printed with the relevant counts, but only for those with missing values greater than zero. This is done by arranging the columns in descending order as per the amount of missing data.
CatBoost Handling Imbalanced Classes
Many real-world applications depend on imbalanced datasets, like fraud detection, medical diagnosis, and revenue loss prediction. In these cases, one class is considerably neglected in comparison to the other. The gap can lead to biased models which benefit the dominant class, resulting in low performance by the minority class.
Methods for Handling Imbalanced Data in CatBoost
CatBoost has several built-in solutions for dealing with imbalanced datasets. This includes −
Automatic Class Weights
Balanced Accuracy Metric
Oversampling or Undersampling
Use the scale_pos_weight Parameter
Early Stopping
Let us look at a real-life example of how to handle an imbalanced dataset with CatBoost and then test its performance. We will use a synthetic dataset to evaluate the efficacy of different methods.
Automatic Class Weights
You can assign different weights to different classes in order to give the minority class more weight. This can be done by using the CatBoost class_weights parameter, which help the model to focus more on the minority class.
catboost_params = {
   'iterations': 500,
   'learning_rate': 0.05,
   'depth': 6,
   'loss_function': 'Logloss',
   # Higher weight for minority class
   'class_weights': [1, 10]
}
model = CatBoostClassifier(**catboost_params)
model.fit(X_train, y_train)
Balanced Accuracy Metric
Using evaluation methods that adjust for uneven data is important. The Balanced Accuracy measure, which takes into account both classes, can be used to evaluate models.
from sklearn.metrics import balanced_accuracy_score

y_pred = model.predict(X_test)
balanced_acc = balanced_accuracy_score(y_test, y_pred)
print("Balanced Accuracy:", balanced_acc)
Oversampling or Undersampling
Before training the model, you can either oversample the minority class or undersample the majority class to balance the dataset. Synthetic Minority Over-sampling Technique is one technique that can be used to create synthetic samples for the minority class.
from imblearn.over_sampling import SMOTE

sm = SMOTE()
X_resampled, y_resampled = sm.fit_resample(X_train, y_train)

model = CatBoostClassifier(iterations=500, learning_rate=0.05, depth=6)
model.fit(X_resampled, y_resampled)
Use the scale_pos_weight Parameter
This parameter is very useful when the dataset is very much imbalanced. It basically adjusts the loss function for the minority class to decrease the imbalance.
catboost_params = {
   'iterations': 500,
   'learning_rate': 0.05,
   'depth': 6,
   'loss_function': 'Logloss',
   # Increase for the minority class
   'scale_pos_weight': 10
}
model = CatBoostClassifier(**catboost_params)
model.fit(X_train, y_train)
Early Stopping
In highly imbalanced data sets, early stopping is very helpful in preventing the model from overfitting to the majority class.
model = CatBoostClassifier(iterations=500, learning_rate=0.05, depth=6)
model.fit(X_train, y_train, eval_set=(X_val, y_val), early_stopping_rounds=50)
CatBoost - Classifier
The CatBoost Classifier is a useful tool for handling classification problems, particularly when working with data that includes categorical variables. Gradient boosting is its core method, combines multiple weak models into a single, powerful model. One of CatBoost's primary features is its ability to handle categorical data without requiring their conversion into numerical values.
Now we will go through how to use CatBoost Classifier. We will take an example where we want to use certain data to predict something.
Steps to use CatBoostClassifier
Now let us walk through the steps of using CatBoost Classifier −
1. Prepare Your Data
Data: A collection of data must be obtained in order to train the model. Suppose you have a list of people, together with their age, gender, and salary. You want to predict whether or not every person would buy a product. Here −
Features (X): The particulars, like age, gender, and price.
Labels (y): The response, including if they purchased the item or not.
Training Data: It is the data the model will learn from.
Testing Data: It is the data that you will use to see if the model is working well.
Example
Here is the example of how you can prepare data −
X_train, X_test, y_train, y_test = train_test_split (data, labels, test_size=0.2)
2. Build the CatBoost Classifier
Next, the CatBoost model is generated. You can change a number of parameters, like −
iterations: How many little models, or trees, it will generate. Every tree learns from the errors made by its previous ones.
learning_rate: The rate of learning of the model. If it is too fast, the model might miss important details. If it is too slow so it will take a long time to learn.
depth: It is tree's overall depth. Increasing complex features can be captured by the model with increasing depth, but overfitting could become more probable.
Example
Here is the example of how you can build catboost classifier −
model = CatBoostClassifier (iterations=1000, learning_rate=0.1, depth=6)
3. Train the Model
Once the data and model are available, the model needs to be trained. It indicates that the model will look through the training data and try to find any patterns. Here fit command tells the model to learn from the training data (X_train and y_train). And verbose=100 means the model will show its progress every 100 iterations so you can see how it is learning.
model.fit (X_train, y_train, verbose=100)
4. Make Predictions
After the model has been trainedyou can use it to make predictions. For example- it will predict the result (y_test) when you provide it new data (X_test).
preds = model.predict(X_test)
5. Evaluate the Model
After making your predictions, you have to evaluate the model's performance. One way to do this is by checking how accurate the model's predictions are.
accuracy = accuracy_score(y_test, preds)
print(f"Accuracy is: {accuracy}")
Example to use CatBoostClassifier
We will use a dataset of Housing.csv to show how to create a CatBoost Classifier model. To create the model we will follow the above steps −
import pandas as pd
from catboost import CatBoostClassifier
from sklearn.model_selection import train_test_split
from sklearn.metrics import accuracy_score, classification_report

# 1. Load the dataset
data = pd.read_csv('/Python/Housing.csv')

# Step 3: Preprocess the Data
# Convert categorical variables to numeric
categorical_features = ['mainroad', 'guestroom', 'basement', 'hotwaterheating', 'airconditioning', 'prefarea', 'furnishingstatus']
for col in categorical_features:
    data[col] = data[col].map({'yes': 1, 'no': 0})

# Target variable
X = data.drop('price', axis=1)
y = data['price']

# Step 4: Split the Data
X_train, X_test, y_train, y_test = train_test_split(X, y, test_size=0.2, random_state=42)

# Step 5: Train the Model
model = CatBoostClassifier(iterations=100, depth=6, learning_rate=0.1, random_seed=42, verbose=0)
model.fit(X_train, y_train)

# Step 6: Evaluate the Model
y_pred = model.predict(X_test)
accuracy = accuracy_score(y_test, y_pred)
report = classification_report(y_test, y_pred)

print(f"Accuracy: {accuracy:.2f}")
print("Classification Report:")
print(report)
Output
Here is the outcome −
Accuracy: 0.00
Classification Report:
              precision    recall  f1-score   support

     1750000       0.00      0.00      0.00       1.0
     1820000       0.00      0.00      0.00       1.0
     1890000       0.00      0.00      0.00       2.0
     2100000       0.00      0.00      0.00       1.0
     2233000       0.00      0.00      0.00       1.0
     .
     .
     .
     9800000       0.00      0.00      0.00       2.0
    10150000       0.00      0.00      0.00       1.0
    12250000       0.00      0.00      0.00       1.0
    13300000       0.00      0.00      0.00       1.0

    accuracy                           0.00     109.0
   macro avg       0.00      0.00      0.00     109.0
weighted avg       0.00      0.00      0.00     109.0
CatBoost - Model Training
CatBoost is a high-performance gradient-boosting method created for machine learning applications, specifically ones that need structured input. Gradient boosting forms the foundation of its main process. Usually, CatBoost begins by making assumptions about the mean of the target variable.
The next stage is to progressively build the ensemble of decision trees, with each tree seeking to remove the residuals or errors from the previous one. CatBoost is different in the way it handles categorical features. CatBoost uses a technique called "ordered boosting" to evaluate category input directly, improving model performance and simplifying training.
Additionally, regularization methods are used to prevent overfitting. CatBoost combines calculated values from every tree to create predictions, generating highly precise and stable models. Also, it provides feature relevance scores to help with understanding of feature and model selections. CatBoost is a valuable tool for a number of machine-learning problems like regression and classification.
So let us see how we can train the CatBoost model in this chapter −
Implementation Using CatBoost
To use CatBoost you need to install it in your system. To install you can use 'pip install catboost'. Type this command on your terminal and the package will be installed automatically.
Import required Libraries and Dataset
So you have to import the required libraries to build your model. Also we are using placement dataset to build our model in this chapter. So will load the data into the pandas dataframe and display it using the pd.read_csv() function. Let us see how we can do this −
import pandas as pd
import numpy as np
import seaborn as sb
import matplotlib.pyplot as plt

from sklearn.preprocessing import StandardScaler
from sklearn.model_selection import train_test_split
from catboost import CatBoostClassifier
from sklearn.metrics import roc_auc_score as ras

import warnings
warnings.filterwarnings('ignore')

# Load you dataset here
df = pd.read_csv('placementdata.csv')
print(df.head())
Output
This code will produce the following outcome −
   StudentID  CGPA  Internships  Projects  Workshops/Certifications  \
0          1   7.5            1         1                         1
1          2   8.9            0         3                         2
2          3   7.3            1         2                         2
3          4   7.5            1         1                         2
4          5   8.3            1         2                         2

   AptitudeTestScore  SoftSkillsRating ExtracurricularActivities  \
0                 65               4.4                        No
1                 90               4.0                       Yes
2                 82               4.8                       Yes
3                 85               4.4                       Yes
4                 86               4.5                       Yes

  PlacementTraining  SSC_Marks  HSC_Marks PlacementStatus
0                No         61         79       NotPlaced
1               Yes         78         82          Placed
2                No         79         80       NotPlaced
3               Yes         81         80          Placed
4               Yes         74         88          Placed
If we take the time to look at the data above, we can see that this dataset contains information about the students' academic, training, and placement status.
Shape And Info of the Dataset
Let us now find out the structure and information of the dataset in order to calculate the total number of data entries that have been given. The content of each column, the data types that are present in it, and the amount of null values that are present in each column can all be seen by using the df.info() method.
# Shape of the dataset
df.shape

# Information of the dataset
df.info()
Output
This will result in the following outcome −
(10000, 12)

<class 'pandas.core.frame.DataFrame'>
RangeIndex: 10000 entries, 0 to 9999
Data columns (total 12 columns):
 #   Column                     Non-Null Count  Dtype
---  ------                     --------------  -----
 0   StudentID                  10000 non-null  int64
 1   CGPA                       10000 non-null  float64
 2   Internships                10000 non-null  int64
 3   Projects                   10000 non-null  int64
 4   Workshops/Certifications   10000 non-null  int64
 5   AptitudeTestScore          10000 non-null  int64
 6   SoftSkillsRating           10000 non-null  float64
 7   ExtracurricularActivities  10000 non-null  object
 8   PlacementTraining          10000 non-null  object
 9   SSC_Marks                  10000 non-null  int64
 10  HSC_Marks                  10000 non-null  int64
 11  PlacementStatus            10000 non-null  object
dtypes: float64(2), int64(7), object(3)
memory usage: 937.6+ KB
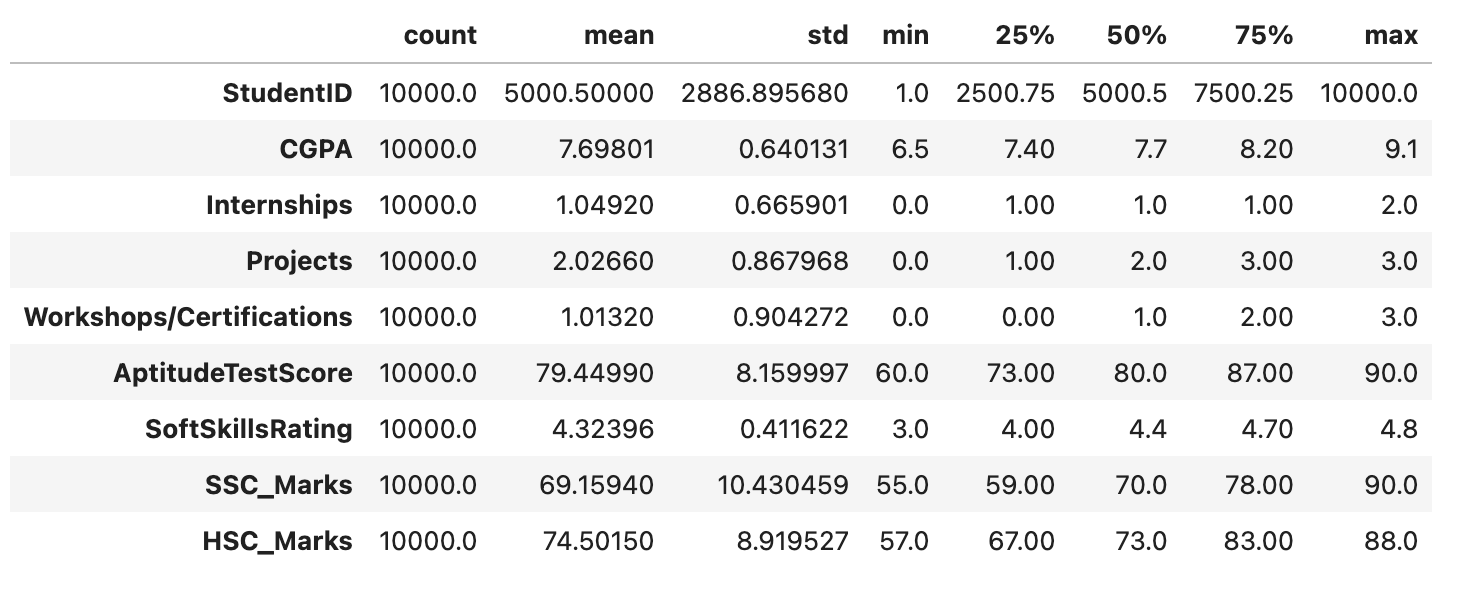
The DataFrame df is statistically represented by the df.describe() function. Key statistics, like count, mean, standard deviation, minimum, and maximum values, are given for each numerical column to give an initial understanding of the data distribution and primary patterns.
df.describe().T
Output
This code will produce the following outcome −
Exploratory Data Analysis(EDA)
EDA is a data analysis technique that uses visualizations. It is used to identify trends and patterns as well as to confirm conclusions with the use of statistical reports and graphical representations. While performing the EDA on this dataset, we will try to find out the relationship that is, how one effects the other between the independent features.
Let us start by taking a quick look at the null values in each column of the data frame.
df.isnull().sum()
Output
This code will generate the below outcome −
StudentID                    0
CGPA                         0
Internships                  0
Projects                     0
Workshops/Certifications     0
AptitudeTestScore            0
SoftSkillsRating             0
ExtracurricularActivities    0
PlacementTraining            0
SSC_Marks                    0
HSC_Marks                    0
PlacementStatus              0
dtype: int64
Since there are no null values in the dataset, we can continue with the data exploration.
Target Class Distributions
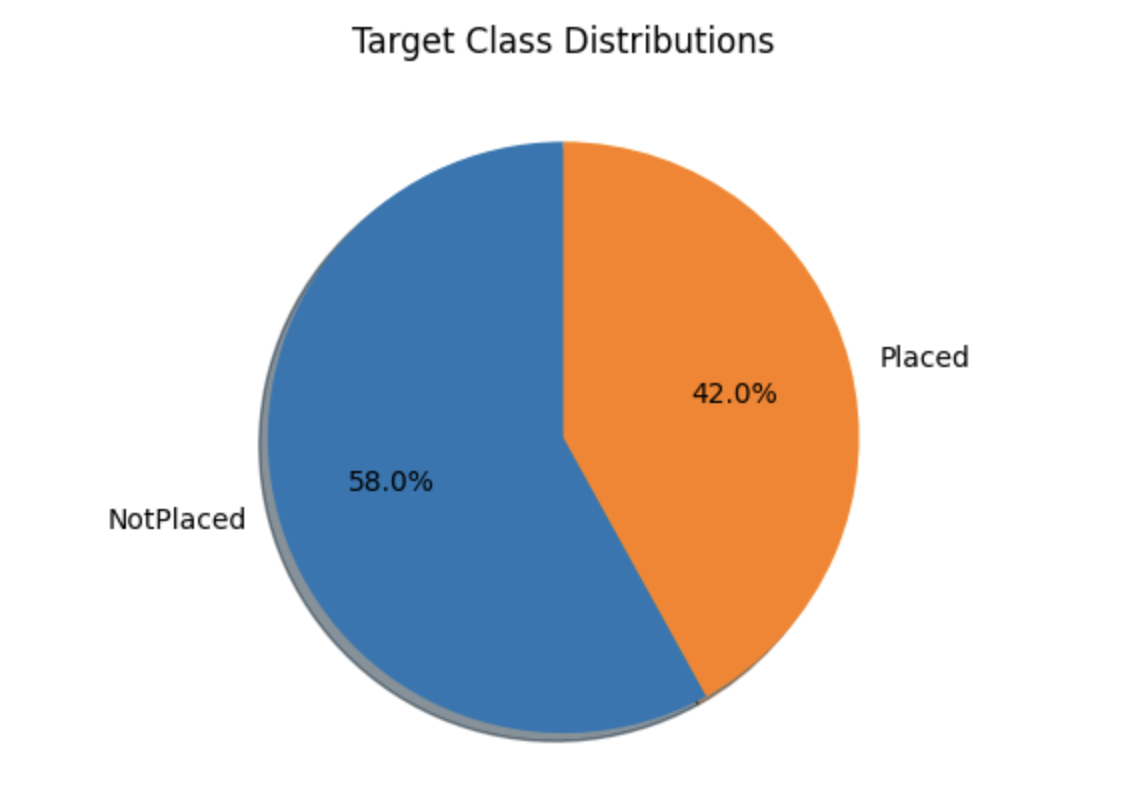
temporary = df['PlacementStatus'].value_counts()

plt.pie(temporary.values, labels=temporary.index.values,
	shadow=True, startangle=90, autopct='%1.1f%%')
plt.title("Target Class Distributions")

plt.show()
Output
The pie chart below displays the approximately balanced class distribution of the dataset. While this may not be perfect, it is still acceptable. The dataset includes both category and number columns, as we can see. Let us divide the dataset into two lists before we look at these attributes.
Divide the Columns
Now we will be dividing the columns of a DataFrame (df) in two main categories- categorical columns and numerical columns.
categorical_columns, numerical_columns = list(), list()

for col in df.columns:
   if df[col].dtype == 'object' or df[col].nunique() < 10:
      categorical_columns.append(col)
   else:
      numerical_columns.append(col)

print('Categorical Columns:', categorical_columns)
print('Numerical Columns:', numerical_columns)
Output
This code will produce the following outcome −
Categorical Columns: ['Internships', 'Projects', 'Workshops/Certifications', 'ExtracurricularActivities', 'PlacementTraining', 'PlacementStatus']
Numerical Columns: ['StudentID', 'CGPA', 'AptitudeTestScore', 'SoftSkillsRating', 'SSC_Marks', 'HSC_Marks']
Countplot for Categorical Columns
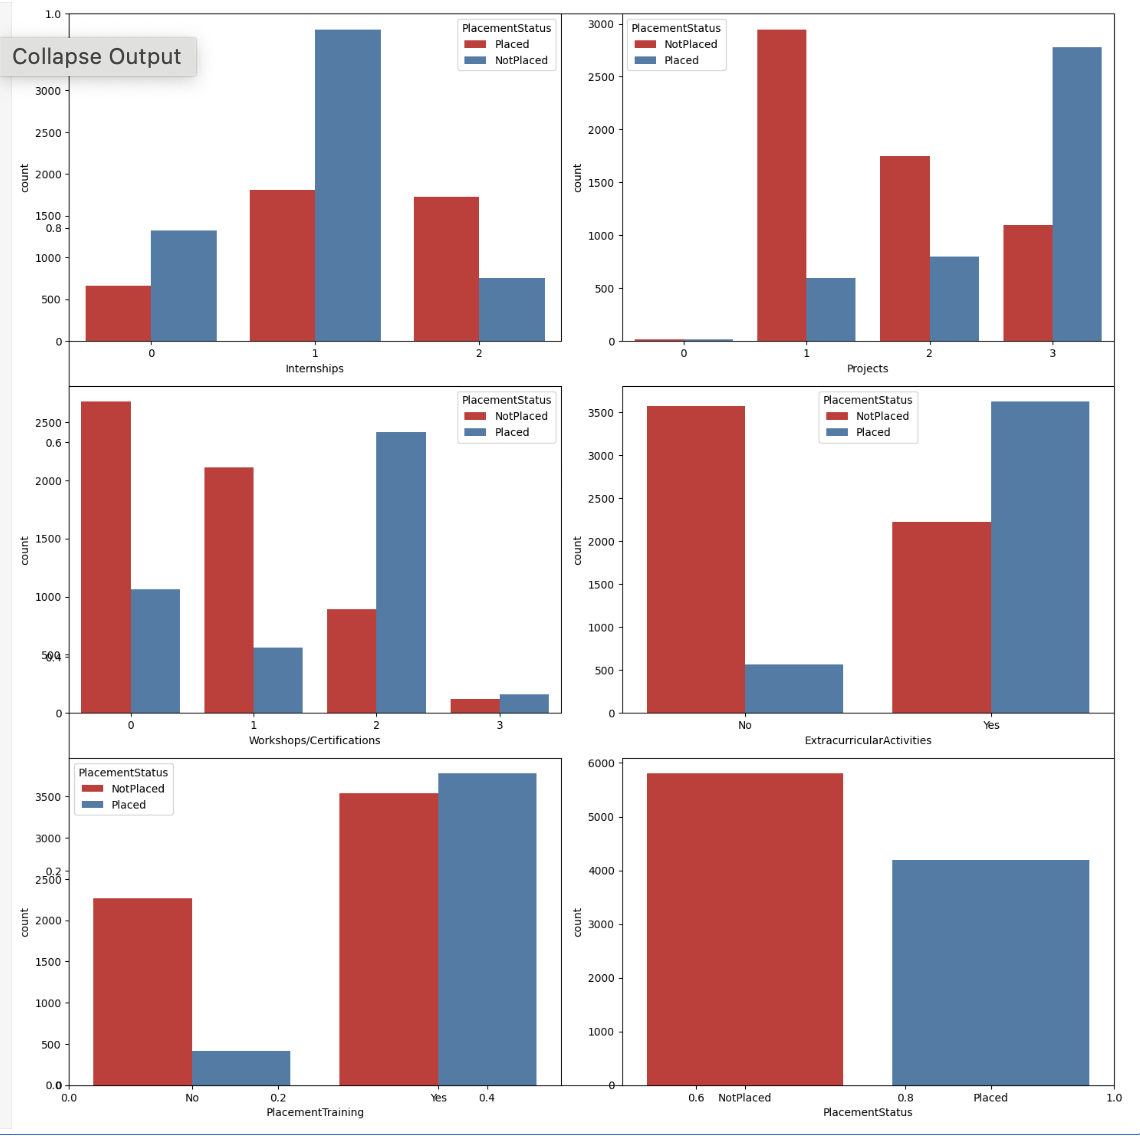
Now we will create countplot for the Categorical Columns with the help of the hue of placement status.
plt.subplots(figsize=(15, 15))

for i, col in enumerate(categorical_columns):
   plt.subplot(3, 2, i+1)
   sb.countplot(data=df, x=col, hue='PlacementStatus', palette='Set1')
plt.tight_layout()
plt.show()
Output
The charts provided shown below show multiple patterns that support the idea that focusing on your skill development will surely help with your placement. While it is true that some students have completed training courses and projects and are still not placed, this is a relatively small number in comparison to those who have done nothing.
Label Encoding of Categorical Columns
After the encoding of the dataset's categorical features, we will create a heatmap that will help in identifying the highly correlated characteristics inside the feature space with the target columns.
for col in ['ExtracurricularActivities', 'PlacementTraining']:
   df[col] = df[col].map({'No':0,'Yes':1})

df['PlacementStatus']=df['PlacementStatus'].map({'NotPlaced':0, 'Placed':1})
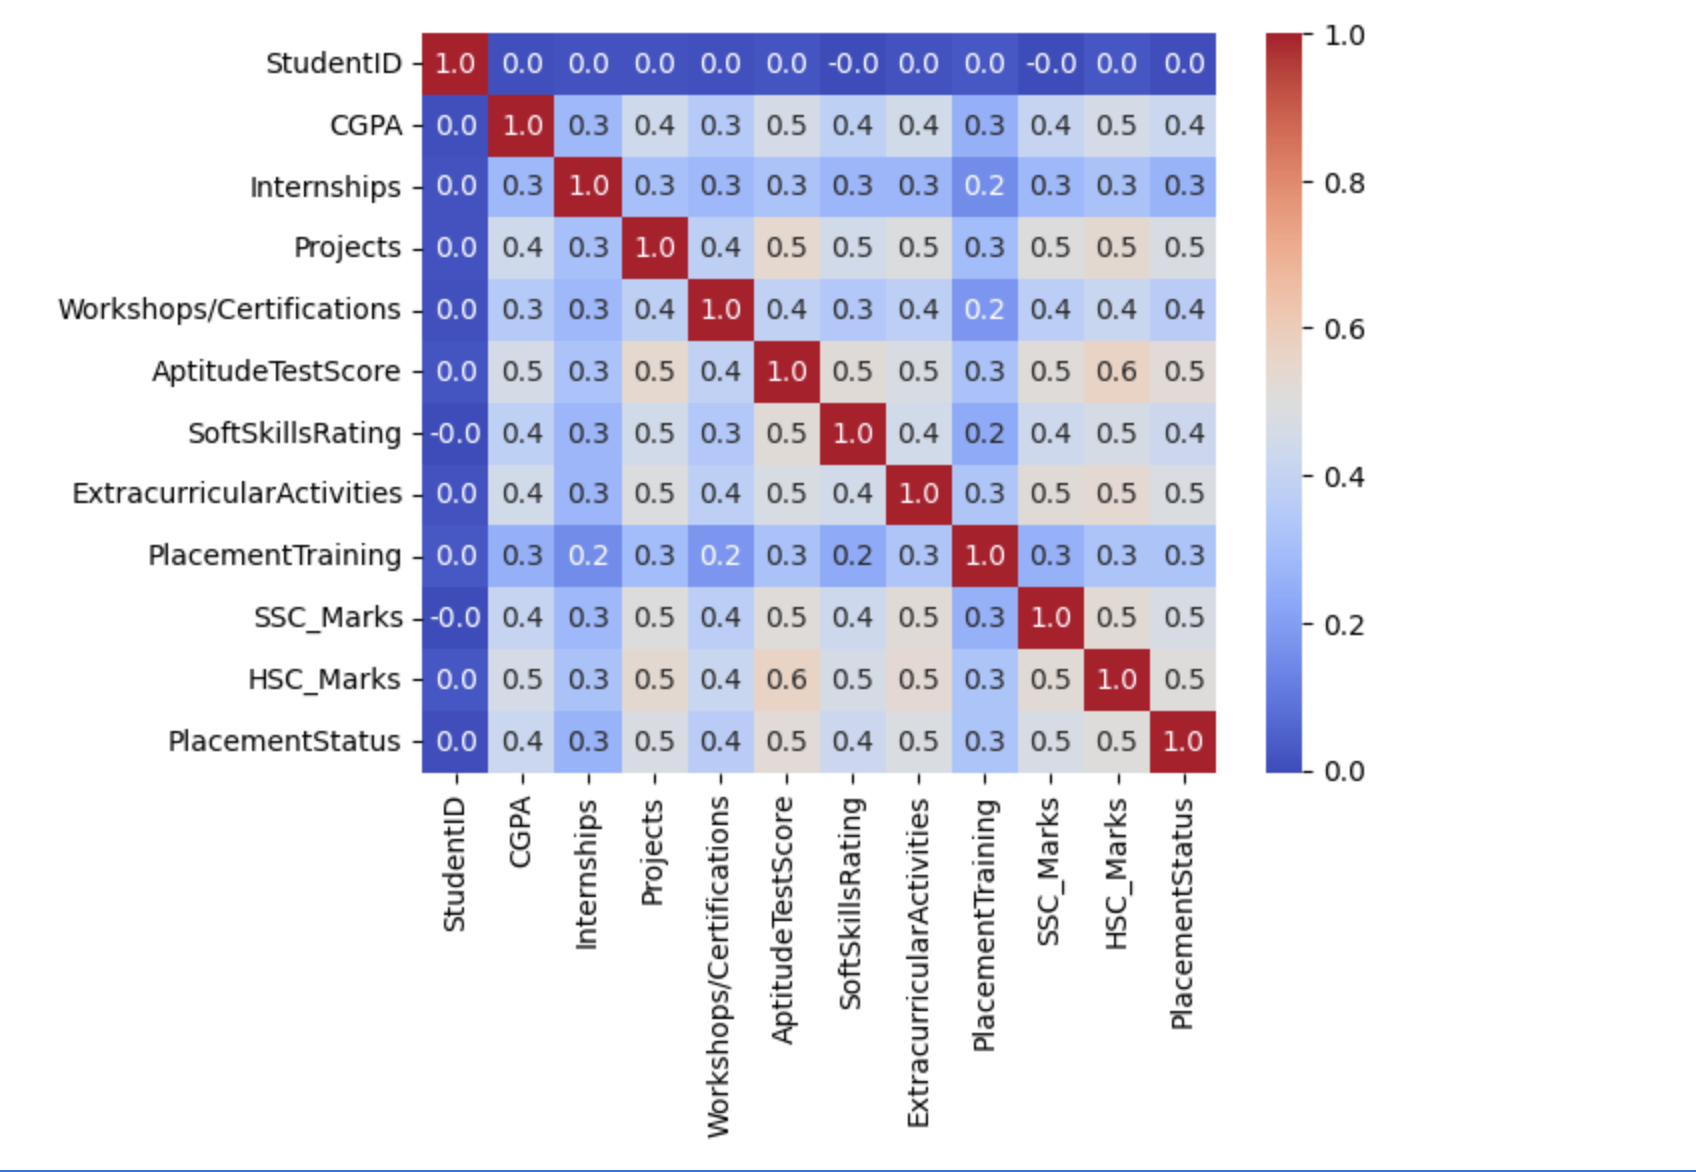
Confusion Matrix
Now we will create the confusion matrix for the above dataset.
sb.heatmap(df.corr(), fmt='.1f', cbar=True, annot=True, cmap='coolwarm')
plt.show()
Output
The below outcome shows that there is no data leakage because the dataset does not contain any highly connected or correlated features.
Train and Validations Data Split
Let us divide the dataset in an 85:15 ratio in order to figure out the model's performance during training. This allows us evaluate the model's performance using the validation split's unseen dataset.
features = df.drop(['StudentID', 'PlacementStatus'], axis=1)
target = df['PlacementStatus']

X_train, X_val, Y_train, Y_val = train_test_split(
   features,
   target,
   random_state=2023,
   test_size=0.15)

X_train.shape, X_val.shape
Output
This will bring about the following outcome −
((8500, 10), (1500, 10))
Feature scaling
This code fits the StandardScaler to the training data in order to compute the mean and standard deviation, providing consistent scaling between the two datasets. After that it uses these computed values to convert the training and validation data.
scaler = StandardScaler()
scaler.fit(X_train)
X_train = scaler.transform(X_train)
X_val = scaler.transform(X_val)
Build and Train the Model
We can now start training the model with the available training data. Since there are only two possible values in the target columns, Y_train and Y_val, binary classification is being performed in this case. Separate specifications are not needed whether the model is being trained for a binary or multi-class classification task.
ourmodel = CatBoostClassifier(verbose=100,
	iterations=1000,
	loss_function='Logloss',
	early_stopping_rounds=50,
	custom_metric=['AUC'])

ourmodel.fit(X_train, Y_train,
	eval_set=(X_val, Y_val))

y_train = ourmodel.predict(X_train)
y_val = ourmodel.predict(X_val)
Output
This will lead to the following outcome −
Learning rate set to 0.053762
0:	learn: 0.6621705	test: 0.6623146	best: 0.6623146 (0)	total: 64.3ms	remaining: 1m 4s
100:	learn: 0.3975289	test: 0.4332971	best: 0.4332174 (92)	total: 230ms	remaining: 2.05s
Stopped by overfitting detector  (50 iterations wait)

bestTest = 0.4330066724
bestIteration = 125

Shrink model to first 126 iterations.
Evaluate Model's Performance
Now let us use the ROC AUC measure to evaluate the model's performance on the training and validation data sets.
print("Training ROC AUC: ", ras(Y_train, y_train))
print("Validation ROC AUC: ", ras(Y_val, y_val))
Output
This will bring about the following outcome −
Training ROC AUC:  0.8175316989019953
Validation ROC AUC:  0.7859439713002392
CatBoost - Metrics for Model Evaluation
Effective evaluation is necessary while creating models for machine learning in order to make sure that the model's performance meets growing standards and requirements. Yandex's CatBoost is a powerful gradient-boosting library that gives data scientists and machine learning professionals a set of metrics to evaluate the effectiveness of their models.
CatBoost is known for handling categorical features with ease, accuracy, and effectiveness. Because of its amazing accuracy, it is preferred for a large number of machine-learning tasks in real-world scenarios.
But the real worth of a model is defined by its actual performance as much as its algorithms. Metrics are helpful in this situation. The two core functions provided by CatBoost for model evaluation are "evaluate ()" and "eval_metric". These functions cover a wide range of features. But CatBoost offers more than just that.
CatBoost Metrics
CatBoost metrics are used to evaluate a model's performance that was created using the machine learning technique CatBoost. These metrics help us understand the quality and accuracy of the model's predictions. Here are some common CatBoost metrics along with their explanation −
Accuracy
Accuracy is a widely used parameter to evaluate the performance of classification models. It evaluates how accurate a model's predicted percentage is for a given dataset.
For binary classifications, the accuracy will be as follows −
Accuracy = {TP + TN}/{TP + TN + FP + FN}
Here,
TP(): The number of cases that were accurately predicted to be positive, or correctly classified as falling within a particular class is known as True Positives or TP.
TN(): The number of cases that were accurately predicted to be negative, or correctly identified as not belonging to a particular class is known as True Negatives or TN.
FP(): The quantity of cases that are mistakenly calculated as positive, meaning they are wrongly categorized as being in a specific class is known as False Positive or FP.
FN(): The quantity of cases that were estimated to be negative, erroneously classified as not falling under a particular category is known as False Negatives or FN.
MultiClass Log Loss
MultiClass log loss, also known as cross-entropy loss or log loss, is a commonly used metric to measure how well classification models perform in multiclass scenarios. It computes the difference between the true class labels and each instance's expected class probability.
The MultiClass log loss is represented mathematically just like below −
Multiclass Log Loss = - (1 / N) i=1N j=1M [ yij * log(pij) ]
Here,
N: The number of samples (or data points).
M: The number of classes.
yij: A binary indicator (0 or 1) that tells whether the sample i belongs to class j. It is 1 if the sample belongs to the class, otherwise 0.
pij: The predicted probability of the sample i being in class j.
Binary Log Loss
Binary Log Loss is a commonly used data to evaluate how well binary classification algorithms perform. It is also referred to as logistic loss or cross-entropy loss. It calculates the difference between each instance's expected probability and the true binary labels.
The binary log loss is represented mathematically as follows −
Binary Log Loss = - (1 / N) i=1N [ yi * log(pi) + (1 - yi) * log(1 - pi) ]
Here,
N: The number of samples (or data points).
yi: A binary indicator (0 or 1) that tells whether the sample i is positive (1) or negative (0).
pi: The predicted probability that the sample i belongs to the positive class (class 1).
log: The natural logarithm.
AUC-ROC (Area Under the Receiver Operating Characteristic)
The effectiveness of a binary classification model over a range of thresholds is graphically shown by the Receiver Operating Characteristic (ROC) curve. At various probability levels, it plots the True Positive Rate (TPR) vs the False Positive Rate (FPR).
The area under the ROC curve, or AUC-ROC, can be computed as follows −
-
True Positive Rate (TPR): It is also known as sensitivity or recall, it is calculated as −
TPR = True Positives (TP) / [True Positives (TP) + False Negatives (FN)]
-
False Positive Rate (FPR): It is calculated as −
FPR = False Positives (FP) / [False Positives (FP) + True Negatives (TN)]
ROC Curve: The ROC curve is plotted at various threshold values, with the TPR on the y-axis and the FPR on the x-axis.
AUC Calculation: Software libraries that provide this function or numerical methods can be used to calculate the area under the ROC curve.
F1-Score
Recall (sensitivity) and precision (positive predictive value) are combined into a single score, the F1 Score, which is a popular metric in binary classification problems that finds a balance between the two.
The F1 Score can be stated mathematically as follows −
F1 = F1 = 2.Precision.Recall / (Precision + Recall)
CatBoost - Classification Metrics
CatBoost is used mostly for classification tasks. To classify something is to put it into a category. We analyze CatBoost's performance in terms of data classification using multiple criteria.
To classify data points into separate categories is the primary objective of classification problems. Multiple metrics are provided by CatBoost to evaluate model performance.
The performance of CatBoost's classification can be evaluated using the following required metrics −
Accuracy
This shows what percentage of the model's predictions were accurate. This is the overall number of accurate projections divided by the total number of predictions. However this measurement makes the most sense in this case, it may not be best for datasets with imbalances (one class significantly outnumbering the other).
To find the accuracy we will have to import libraries like numpy, catboost, sklearn.datasets and sklearn.model_selection.
import numpy as np
from catboost import CatBoostClassifier, Pool
from sklearn.datasets import load_iris
from sklearn.model_selection import train_test_split

# Loading the Iris dataset
iris = load_iris()
X, y = iris.data, iris.target

# Splitting the data into training and testing datasets
X_train, X_test, y_train, y_test = train_test_split(X, y, test_size=0.2, random_state=42)

# Create a CatBoostClassifier
model = CatBoostClassifier(iterations=100, learning_rate=0.1, depth=6, loss_function='MultiClass', verbose=0)

# Create a Pool object
train_pool = Pool(X_train, label=y_train)
test_pool = Pool(X_test, label=y_test)

# Train the model
model.fit(train_pool)

# Evaluate the model
metrics = model.eval_metrics(test_pool, metrics=['Accuracy'], plot=True)

# Print the evaluation metrics
accuracy = metrics['Accuracy'][-1]

print(f'Accuracy is: {accuracy:.2f}')
Output
The result shows that the model is a ideal fit for the dataset and that it has successfully predicted every incidence in the dataset.
MetricVisualizer(layout=Layout(align_self='stretch', height='500px'))
Accuracy: 1.00
Multiclass Log Loss
Multiclass log loss, also known as cross-entropy for multiclass classification, is a variation of log loss designed for multiclass classification problems. This evaluates the point to which expected probabilities match with the actual class labels by predicting a probability distribution over many classes.
import numpy as np
from catboost import CatBoostClassifier, Pool
from sklearn.datasets import load_iris
from sklearn.model_selection import train_test_split

# Loading the Iris dataset
iris = load_iris()
X, y = iris.data, iris.target

# Splitting the data into training and testing sets
X_train, X_test, y_train, y_test = train_test_split(X, y, test_size=0.2, random_state=42)

# Create a CatBoostClassifier
model = CatBoostClassifier(iterations=100, learning_rate=0.1, depth=6, loss_function='MultiClass', verbose=0)

# Create a Pool object
train_pool = Pool(X_train, label=y_train)
test_pool = Pool(X_test, label=y_test)

# Train the model
model.fit(train_pool)

# Evaluate the model for multi-class classification
metrics = model.eval_metrics(test_pool, metrics=['MultiClass'], plot = True)

# Print the evaluation metrics
multi_class_loss = metrics['MultiClass'][-1]

print(f'Multi-Class Loss: {multi_class_loss:.2f}')
Output
In the below result, a multi-class loss value of 0.03 indicates that the model is performing well in terms of multi-class classification on the test dataset.
MetricVisualizer(layout=Layout(align_self='stretch', height='500px'))
Multi-Class Loss: 0.03
Binary Log Loss
Binary Log loss measures the difference between the true labels and the predicted probability. Lower log loss values shows better performance. This meter is useful for making accurate predictions. And it can be used in situations needs for a more precise measurement of probability, like fraud detection or medical diagnosis. It is often brought up when talking about binary classification, which is when the dataset has only two classes.
Because the Iris dataset has three classes, it is not suitable for this metric. With the help of the Breast Cancer dataset we can see that it has just two classes: those that represent the presence and absence of breast cancer.
import numpy as np
from catboost import CatBoostClassifier, Pool
from sklearn.datasets import load_breast_cancer
from sklearn.model_selection import train_test_split

# Loading the Breast Cancer dataset
data = load_breast_cancer()
X, y = data.data, data.target

# Splitting the data into training and testing datasets
X_train, X_test, y_train, y_test = train_test_split(X, y, test_size=0.2, random_state=42)

# Create a CatBoostClassifier
model = CatBoostClassifier(iterations=100, learning_rate=0.1, depth=6, verbose=0)

# Create a Pool object
train_pool = Pool(X_train, label=y_train)
test_pool = Pool(X_test, label=y_test)

# Train the model
model.fit(train_pool)

# Evaluate the model
metrics = model.eval_metrics(test_pool, metrics=['Logloss'], plot =False)

# Print the evaluation metrics
logloss = metrics['Logloss'][-1]

print(f'Log Loss (Cross-Entropy): {logloss:.2f}')
Output
Here is the output of the above code −
Log Loss (Cross-Entropy): 0.08
AUC-ROC and AUC-PRC
Area Under the Receiver Operating Characteristic Curve (AUR-ROC) and Area Under the Precision-Recall Curve (AUC-PRC) are critical metrics for binary classification algorithms. AUC-ROC evaluates the model's ability to differentiate between positive and negative classifications whereas AUC-PRC focuses more closely on the trade-offs between precision and recall.
import catboost
from catboost import CatBoostClassifier, Pool
from sklearn import datasets
from sklearn.model_selection import train_test_split

# Loading the Iris dataset
iris = datasets.load_iris()
X = iris.data
y = iris.target

# Converting to binary classification by mapping
y_binary = (y == 2).astype(int)

# Splitting the dataset into training and testing sets
X_train, X_test, y_train, y_test = train_test_split(X, y_binary, test_size=0.2, random_state=42)

# Creating a CatBoost classifier with AUC-ROC metric
model = CatBoostClassifier(iterations=500, random_seed=42, eval_metric='AUC')

# Converting the training data into a CatBoost Pool
train_pool = Pool(X_train, label=y_train)

# Training the model
model.fit(train_pool, verbose=100)

validation_pool = Pool(X_test, label=y_test)
eval_result = model.eval_metrics(validation_pool, ['AUC'])['AUC']
metrics = model.eval_metrics(validation_pool, metrics=['PRAUC'],plot = True)
auc_pr = metrics['PRAUC'][-1]

# Print the evaluation metrics

print(f'AUC-PR: {auc_pr:.2f}')

print(f"AUC-ROC: {eval_result[-1]:.4f}")
Output
This will bring about the following outcome −
Learning rate set to 0.007867
0:	total: 2.09ms	remaining: 1.04s
100:	total: 42.3ms	remaining: 167ms
200:	total: 67.9ms	remaining: 101ms
300:	total: 89.8ms	remaining: 59.4ms
400:	total: 110ms	remaining: 27ms
499:	total: 129ms	remaining: 0us
MetricVisualizer(layout=Layout(align_self='stretch', height='500px'))
AUC-PR: 1.00
AUC-ROC: 1.0000
F1 Score
The F1 Score are the model's accuracy, or how well it predicts a category, and recall, or how often it was able to identify that category. To balance the trade-off between false positives and false negatives, this statistic is perfect. Also we need to keep in mind that the better models tend to have higher F1 Scores.
import numpy as np
from catboost import CatBoostClassifier, Pool
from sklearn.datasets import load_breast_cancer
from sklearn.model_selection import train_test_split

# Loading the Breast Cancer dataset
data = load_breast_cancer()
X, y = data.data, data.target

# Splitting the data into training and testing datasets
X_train, X_test, y_train, y_test = train_test_split(X, y, test_size=0.2, random_state=42)

# Creating a CatBoostClassifier
model = CatBoostClassifier(iterations=100, learning_rate=0.1, depth=6, verbose=0)

# Creating a Pool object
train_pool = Pool(X_train, label=y_train)
test_pool = Pool(X_test, label=y_test)

# Train the model
model.fit(train_pool)

# Evaluate the model
metrics = model.eval_metrics(test_pool, metrics=['F1'], plot=True)

# Print the evaluation metrics
f1 = metrics['F1'][-1]

print(f'F1 Score: {f1:.2f}')
Output
This will lead to the following outcome −
MetricVisualizer(layout=Layout(align_self='stretch', height='500px'))
F1 Score: 0.98
Summary
In summary, CatBoost provides a wide array of metrics and evaluation tools that greatly simplify the model selection and evaluation process. It starts with its built-in evaluation measures for classification tasks, like Mean Squared Error and Logloss but it also allows customisation with user-defined metrics. A complete evaluation is ensured by the capacity to use early stopping, cross-validate, and monitor many metrics throughout training. It offers a wide range of metrics for tasks needing classification.
CatBoost - Over-fitting Detection
Over-fitting is the term used to describe a model that performs well on training data but poorly on unknown data. CatBoost provides metrics to evaluate over-fitting.
Here are some common CatBoost metrics to explain over-fitting protection −
Cross-Validation
Cross-validation is one of the most significant machine learning methods for finding and lower over-fitting. By comparing training and validation performance cross validation helps in the detection of over-fitting.
This method analyses a CatBoostClassifier performance of the model using cross validation on the Iris dataset. Using cross validation is a common method to stop overfitting which is a situation where a model performs on new data because it is overtuned to training data. Furthermore, cross-validation improves our understanding of the real performance of the model. To determine the performance level of the model it determines a number of measures.
# Import required libraries
import numpy as np
from catboost import CatBoostClassifier, Pool, cv
from sklearn.datasets import load_iris
from sklearn.model_selection import train_test_split

# Load the required dataset
iris = load_iris()
X, y = iris.data, iris.target

# Generate a CatBoost Pool object
data_pool = Pool(X, label=y)

# Defining the CatBoostClassifier parameters
params = {
	'iterations': 100,
	'learning_rate': 0.1,
	'depth': 6,
	'loss_function': 'MultiClass',
	'verbose': 0
}

# Do cross-validation
cv_results = cv(pool=data_pool,
				params=params,
				fold_count=5,
				shuffle=True,
				partition_random_seed=42,
				verbose_eval=False)

# Print the results
for metric_name in cv_results.columns:
	if 'test-' in metric_name:
		mean_score = cv_results[metric_name].iloc[-1]
		print(f'{metric_name}: {mean_score:.4f}')
Output
This will produce the following result −
Training on fold [0/5]

bestTest = 0.1226007055
bestIteration = 72

Training on fold [1/5]

bestTest = 0.09388296402
bestIteration = 99

Training on fold [2/5]

bestTest = 0.05707644554
bestIteration = 99

Training on fold [3/5]

bestTest = 0.1341533772
bestIteration = 93

Training on fold [4/5]

bestTest = 0.19934632
bestIteration = 94

test-MultiClass-mean: 0.1221
test-MultiClass-std: 0.0531
Feature Importance
CatBoost also offers a feature importance score. It can be used for determining the features importance and usefulness as well as how they affect the prediction made by the model. Using feature importance over-fitting can be detected by highlighting variables that have an impact on the predictions of the model. If a feature has no impact on the model's predictions it can become over-fit to the model.
The resulting bar plot will highlight the importance of each feature in the predictions of the model. The features that are most important for the classification process can be identified by with the help of this data to rank engineering or feature selection jobs.
import numpy as np
import matplotlib.pyplot as plt
from catboost import CatBoostClassifier, Pool
from sklearn.datasets import load_iris
from sklearn.model_selection import train_test_split

# Load the Iris dataset
iris_dataset = load_iris()
X_data, y_labels = iris_dataset.data, iris_dataset.target

# Split the data into training and testing sets
X_train_data, X_test_data, y_train_labels, y_test_labels = train_test_split(X_data, y_labels, test_size=0.2, random_state=42)

# Create a CatBoostClassifier
catboost_model = CatBoostClassifier(iterations=100, learning_rate=0.1, depth=6, loss_function='MultiClass', verbose=0)

# Train the model
catboost_model.fit(X_train_data, y_train_labels)

# Create a Pool object for the testing data
test_data_pool = Pool(X_test_data)

# Get feature importance scores
feature_importance_scores = catboost_model.get_feature_importance(test_data_pool)

# Get feature names
feature_labels = iris_dataset.feature_names

# Plot feature importance with changed color
plt.figure(figsize=(10, 6))
plt.barh(range(len(feature_importance_scores)), feature_importance_scores, color='skyblue', tick_label=feature_labels)
plt.xlabel('Feature Importance Score')
plt.ylabel('Features')
plt.title('Feature Importance for CatBoost Classifier')
plt.show()
Output
Here is the result produced using the above code −
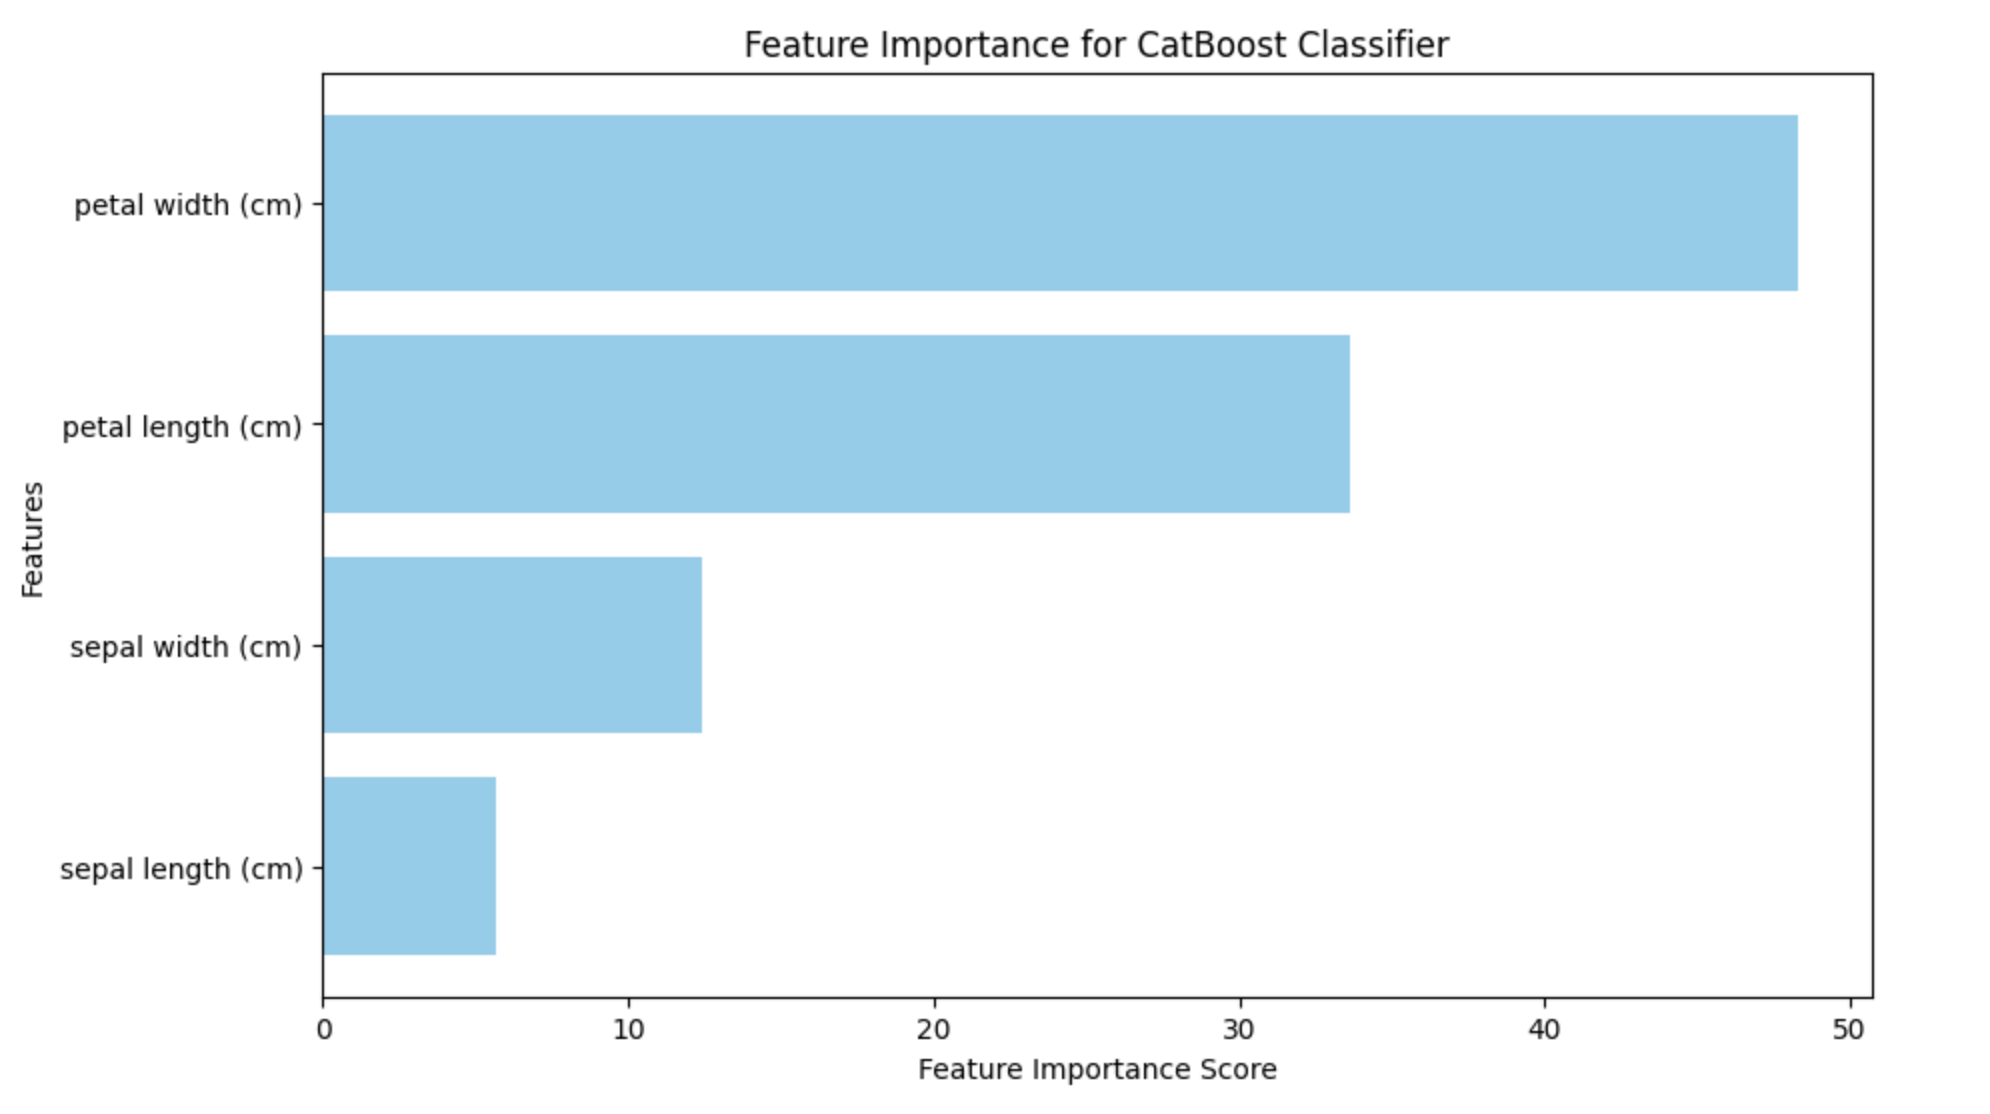
Identifying over-fitting also depends largely on the learning curve. There is not a different learning curve graphing technique in CatBoost. However, it can be plotted using other Python programs like matplotlib.
CatBoost vs Other Boosting Algorithms
One of the most effective methods for training on structural (tabular) data nowadays is the booster algorithm. The following three well known uses of boosting algorithms have provided various approaches to win machine learning competitions: CatBoost, XGBoost and LightGBM.
The main topics of this chapter will be CatBoost how well it performs compared to other algorithms and when it should be used over other methods.
The foundation of all three of the algorithms for evaluation (CatBoost, XGBoost, and LightGBM) is gradient boosting techniques. It will be useful as we proceed to have a good grasp of gradient boosting. Two varieties of gradient boosting algorithms that predict continuous and categorical variables, respectively, are classifiers and regressions.
This method, in addition to Adaptive Boosting (Adaboost), includes training learners based upon reducing the differential loss function of a weak learner using a gradient descent optimization procedure. So each student receives an equal distribution of the weights. Gradient boosting uses decision trees connected in series as weak learners.
Because of its sequential construction in which decision trees are added one at a time without affecting the ones that already exist, it is a stage-wise additive model.
Reducing the bias error of the model is the primary objective of gradient boosting. Because of its greedy algorithm, the algorithm can overfit a training dataset as per the bias variance tradeoff very quickly. However, to reduce this over-fitting, regularization, shrinkage, tree limitation, and random gradient boosting can all be applied.
Overview of CatBoost
Similar to XGBoost and LightGBM rankers, CatBoost also features a ranking mode called CatBoostRanking, but CatBoost offers many more powerful versions than XGBoost and LightGBM. The differences consist of −
Ranking (YetiRank, YetiRankPairwise)
Pairwise (PairLogit, PairLogitPairwise)
Ranking + Classification (QueryCrossEntropy)
Ranking + Regression (QueryRMSE)
Select top 1 candidate (QuerySoftMax)
Additionally, CatBoost offers ranking benchmarks which compare several ranking variations of CatBoost, XGBoost, and LightGBM, such as −
CatBoost: RMSE, QueryRMSE, PairLogit, PairLogitPairwise, YetiRank, YetiRankPairwise
XGBoost: reg:linear, xgb-lmart-ndcg, xgb-pairwise
LightGBM: lgb-rmse, lgb-pairwise
CatBoost Parameters
Although XGBoost and CatBoost use the same training parameters, it has a far more flexible parameter adjustment interface. The table below provides a quick comparison of the parameters offered by the three boosting methods.
| Function | CatBoost | XGBoost | LightGBM |
|---|---|---|---|
| Parameters controlling over-fitting | learning_rate, depth, l2_reg | learning_rate, max_depth, min_child_weight | learning_rate, Max_depth, Num_leaves, min_data_in_leaf |
| Parameters for handling categorical values | cat_features, one_hot_max_size | N/A | Categorical_feature |
| Parameters for controlling speed | rsm, iteration | colsample_bytree, subsample, n_estimators | feature_fraction, bagging fraction, num_iterations |
CatBoost vs XGBoost vs LightGBM
This section will compare algorithms, features, performance and speed, parameters for over-fitting control, speed control parameters and community support. So check the below table to see the differences −
| Factors | CatBoost | XGBoost | LightGBM |
|---|---|---|---|
| Algorithm Basics | Designed for categorical data, CatBoost natively handles categorical features without needing to preprocess them. | Focuses on gradient boosting and handles missing data efficiently. Known for its accuracy and speed in competitions. | Specializes in large datasets and faster training by using histogram-based methods, making it efficient for large and sparse datasets. |
| Handling Categorical Features | Strong advantage as it can handle categorical features directly using cat_features without manual conversion. | Does not handle categorical features natively, requiring conversion to numerical format like one-hot encoding. | Supports categorical features with the Categorical_feature parameter but not as efficient as CatBoost. |
| Speed and Performance | Generally slower than LightGBM, but optimized for both speed and accuracy when dealing with categorical data. | Slower compared to LightGBM but provides more stable and accurate results across diverse datasets. | Known for its speed, especially with large datasets. It trains faster due to its leaf-wise growth strategy. |
| Parameters for Overfitting Control | Uses parameters like learning_rate, depth, and l2_reg to avoid overfitting. | Controls overfitting with learning_rate, max_depth, and min_child_weight. | Uses learning_rate, Max_depth, Num_leaves, and min_data_in_leaf for managing overfitting with precise tree control. |
| Speed Control Parameters | Parameters like rsm and iteration help control the speed of model training. | Speed can be adjusted using colsample_bytree, subsample, and n_estimators. | Controlled with feature_fraction, bagging_fraction, and num_iterations for speed tuning. |
| Community Support | Popular but with a smaller community compared to XGBoost and LightGBM. | Very popular with extensive community support, tutorials, and pre-built models. | Highly popular for speed in large-scale tasks, with a strong user community. |
| Conclusion | Best for handling categorical features directly without preprocessing. | Ideal for general-purpose tasks where accuracy is key and training time isn't a major concern. | Great for large datasets, especially where fast training is needed with scalable performance. |
