- CatBoost - Home
- CatBoost - Overview
- CatBoost - Architecture
- CatBoost - Installation
- CatBoost - Features
- CatBoost - Decision Trees
- CatBoost - Boosting Process
- CatBoost - Core Parameters
- CatBoost - Data Preprocessing
- CatBoost - Handling Categorical Features
- CatBoost - Handling Missing Values
- CatBoost - Classifier
- CatBoost - Model Training
- CatBoost - Metrics for Model Evaluation
- CatBoost - Classification Metrics
- CatBoost - Over-fitting Detection
- CatBoost vs Other Boosting Algorithms
- CatBoost Useful Resources
- CatBoost - Quick Guide
- CatBoost - Useful Resources
- CatBoost - Discussion
CatBoost - Over-fitting Detection
Over-fitting is the term used to describe a model that performs well on training data but poorly on unknown data. CatBoost provides metrics to evaluate over-fitting.
Here are some common CatBoost metrics to explain over-fitting protection −
Cross-Validation
Cross-validation is one of the most significant machine learning methods for finding and lower over-fitting. By comparing training and validation performance cross validation helps in the detection of over-fitting.
This method analyses a CatBoostClassifier performance of the model using cross validation on the Iris dataset. Using cross validation is a common method to stop overfitting which is a situation where a model performs on new data because it is overtuned to training data. Furthermore, cross-validation improves our understanding of the real performance of the model. To determine the performance level of the model it determines a number of measures.
# Import required libraries
import numpy as np
from catboost import CatBoostClassifier, Pool, cv
from sklearn.datasets import load_iris
from sklearn.model_selection import train_test_split

# Load the required dataset
iris = load_iris()
X, y = iris.data, iris.target

# Generate a CatBoost Pool object
data_pool = Pool(X, label=y)

# Defining the CatBoostClassifier parameters
params = {
	'iterations': 100,
	'learning_rate': 0.1,
	'depth': 6,
	'loss_function': 'MultiClass',
	'verbose': 0
}

# Do cross-validation
cv_results = cv(pool=data_pool,
				params=params,
				fold_count=5,
				shuffle=True,
				partition_random_seed=42,
				verbose_eval=False)

# Print the results
for metric_name in cv_results.columns:
	if 'test-' in metric_name:
		mean_score = cv_results[metric_name].iloc[-1]
		print(f'{metric_name}: {mean_score:.4f}')
Output
This will produce the following result −
Training on fold [0/5]

bestTest = 0.1226007055
bestIteration = 72

Training on fold [1/5]

bestTest = 0.09388296402
bestIteration = 99

Training on fold [2/5]

bestTest = 0.05707644554
bestIteration = 99

Training on fold [3/5]

bestTest = 0.1341533772
bestIteration = 93

Training on fold [4/5]

bestTest = 0.19934632
bestIteration = 94

test-MultiClass-mean: 0.1221
test-MultiClass-std: 0.0531
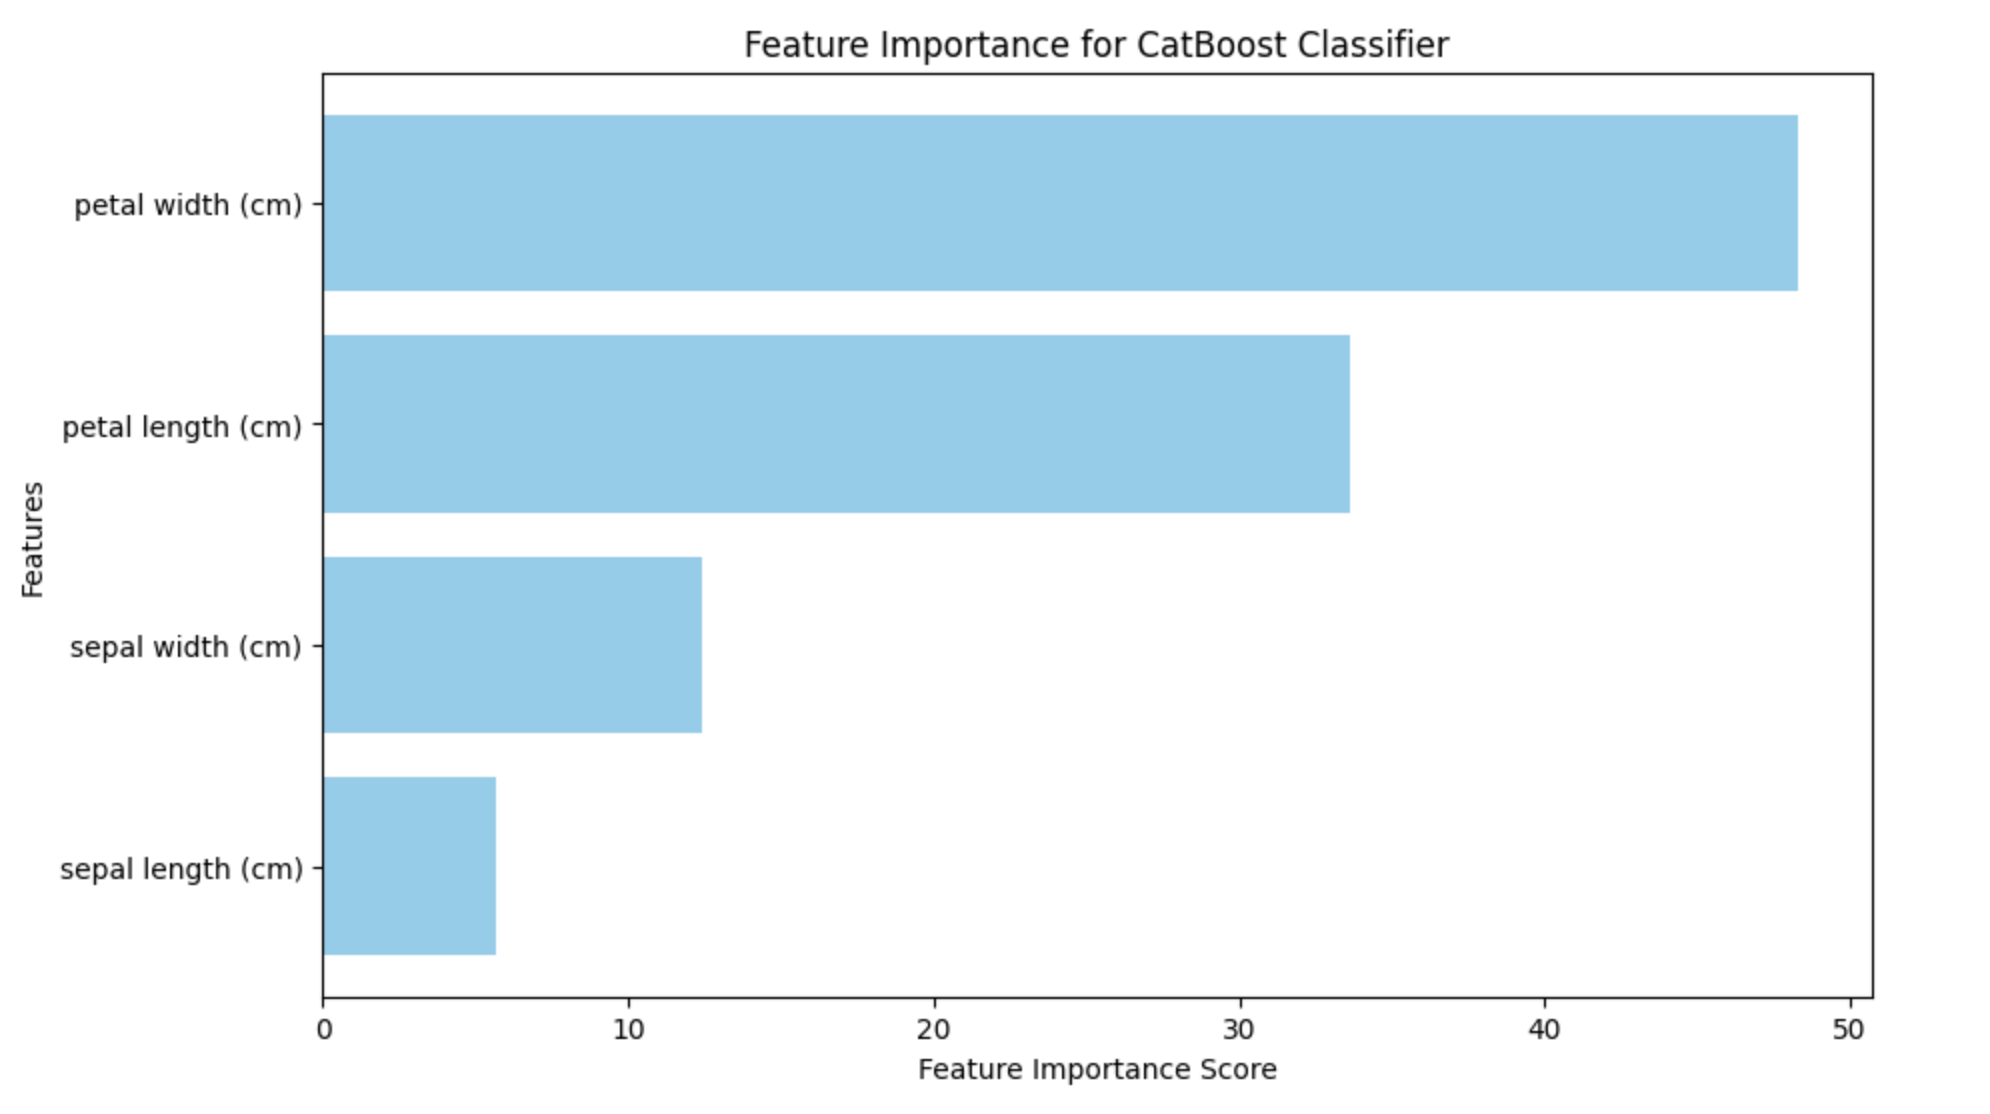
Feature Importance
CatBoost also offers a feature importance score. It can be used for determining the features importance and usefulness as well as how they affect the prediction made by the model. Using feature importance over-fitting can be detected by highlighting variables that have an impact on the predictions of the model. If a feature has no impact on the model's predictions it can become over-fit to the model.
The resulting bar plot will highlight the importance of each feature in the predictions of the model. The features that are most important for the classification process can be identified by with the help of this data to rank engineering or feature selection jobs.
import numpy as np
import matplotlib.pyplot as plt
from catboost import CatBoostClassifier, Pool
from sklearn.datasets import load_iris
from sklearn.model_selection import train_test_split

# Load the Iris dataset
iris_dataset = load_iris()
X_data, y_labels = iris_dataset.data, iris_dataset.target

# Split the data into training and testing sets
X_train_data, X_test_data, y_train_labels, y_test_labels = train_test_split(X_data, y_labels, test_size=0.2, random_state=42)

# Create a CatBoostClassifier
catboost_model = CatBoostClassifier(iterations=100, learning_rate=0.1, depth=6, loss_function='MultiClass', verbose=0)

# Train the model
catboost_model.fit(X_train_data, y_train_labels)

# Create a Pool object for the testing data
test_data_pool = Pool(X_test_data)

# Get feature importance scores
feature_importance_scores = catboost_model.get_feature_importance(test_data_pool)

# Get feature names
feature_labels = iris_dataset.feature_names

# Plot feature importance with changed color
plt.figure(figsize=(10, 6))
plt.barh(range(len(feature_importance_scores)), feature_importance_scores, color='skyblue', tick_label=feature_labels)
plt.xlabel('Feature Importance Score')
plt.ylabel('Features')
plt.title('Feature Importance for CatBoost Classifier')
plt.show()
Output
Here is the result produced using the above code −
Identifying over-fitting also depends largely on the learning curve. There is not a different learning curve graphing technique in CatBoost. However, it can be plotted using other Python programs like matplotlib.
