- Apex - Home
- Apex - Overview
- Apex - Environment
- Apex - Example
- Apex - Data Types
- Apex - Variables
- Apex - Strings
- Apex - Arrays
- Apex - Constants
- Apex - Decision Making
- Apex - Loops
- Apex - Collections
- Apex - Classes
- Apex - Methods
- Apex - Objects
- Apex - Interfaces
- Apex - DML
- Apex - Database Methods
- Apex - SOSL
- Apex - SOQL
- Apex - Security
- Apex - Invoking
- Apex - Triggers
- Apex - Trigger Design Patterns
- Apex - Governer Limits
- Apex - Batch Processing
- Apex - Debugging
- Apex - Testing
- Apex - Deployment
Apex - Environment
In this chapter, we will understand the environment for our Salesforce Apex development. It is assumed that you already have a Salesforce edition set up for doing Apex development.
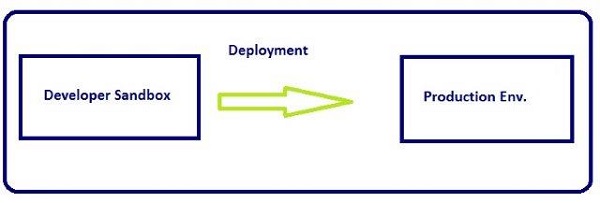
You can develop the Apex code in either Sandbox or Developer edition of Salesforce. A Sandbox organization is a copy of your organization in which you can write code and test it without taking the risk of data modification or disturbing the normal functionality. As per the standard industrial practice, you have to develop the code in Sandbox and then deploy it to the Production environment.
For this tutorial, we will be using the Developer edition of Salesforce. In the Developer edition, you will not have the option of creating a Sandbox organization. The Sandbox features are available in other editions of Salesforce.
Apex Code Development Tools
In all the editions, we can use any of the following three tools to develop the code −
- Force.com Developer Console
- Force.com IDE
- Code Editor in the Salesforce User Interface
Note − We will be utilizing the Developer Console throughout our tutorial for code execution as it is simple and user friendly for learning.
Force.com Developer Console
The Developer Console is an integrated development environment with a collection of tools you can use to create, debug, and test applications in your Salesforce organization.
Follow these steps to open the Developer Console −
Step 1 − Go to Name → Developer Console
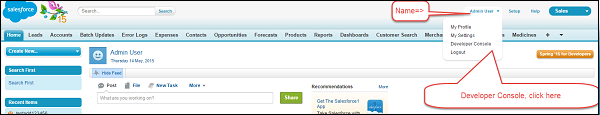
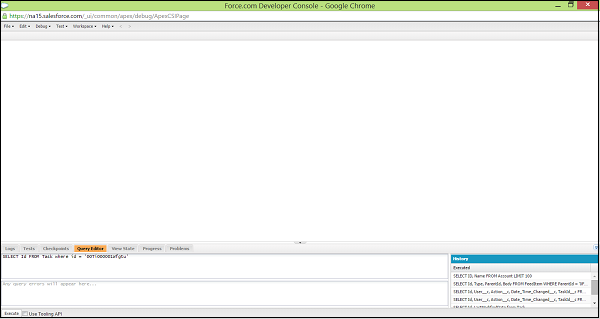
Step 2 − Click on "Developer Console" and a window will appear as in the following screenshot.
Following are a few operations that can be performed using the Developer Console.
Writing and compiling code − You can write the code using the source code editor. When you save a trigger or class, the code is automatically compiled. Any compilation errors will be reported.
Debugging − You can write the code using the source code editor. When you save a trigger or class, the code is automatically compiled. Any compilation errors will be reported.
Testing − You can view debug logs and set checkpoints that aid in debugging.
Checking performance − You can execute tests of specific test classes or all classes in your organization, and you can view test results. Also, you can inspect code coverage.
SOQL queries − You can inspect debug logs to locate performance bottlenecks.
Color coding and autocomplete − The source code editor uses a color scheme for easier readability of code elements and provides auto completion for class and method names.
Executing Code in Developer Console
All the code snippets mentioned in this tutorial need to be executed in the developer console. Follow these steps to execute steps in Developer Console.
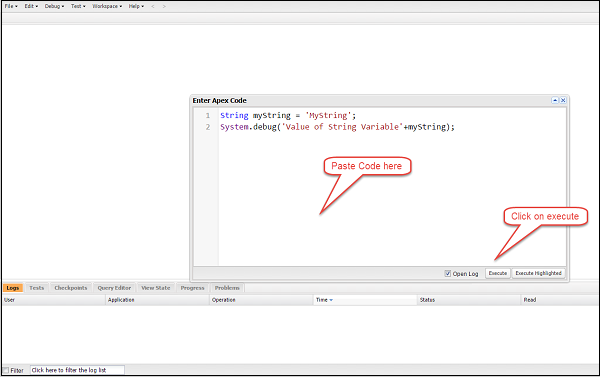
Step 1 − Login to the Salesforce.com using login.salesforce.com. Copy the code snippets mentioned in the tutorial. For now, we will use the following sample code.
String myString = 'MyString';
System.debug('Value of String Variable'+myString);

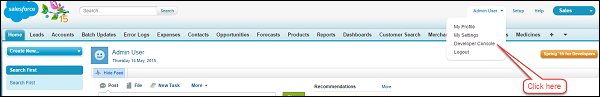
Step 2 − To open the Developer Console, click on Name → Developer Console and then click on Execute Anonymous as shown below.
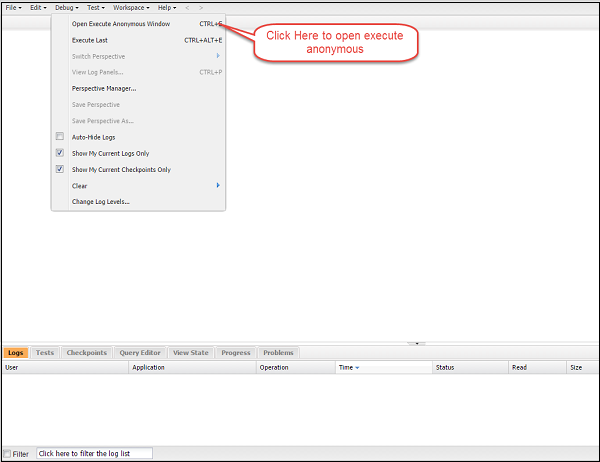
Step 3 − In this step, a window will appear and you can paste the code there.
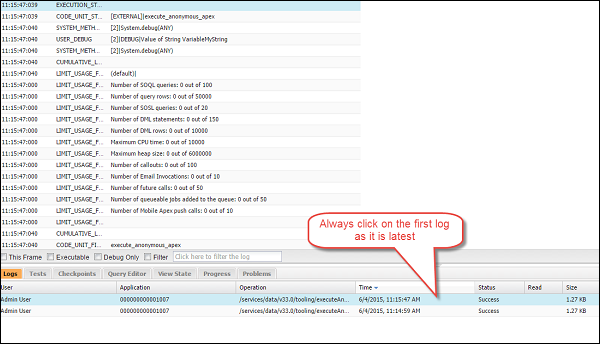
Step 4 − When we click on Execute, the debug logs will open. Once the log appears in window as shown below, then click on the log record.
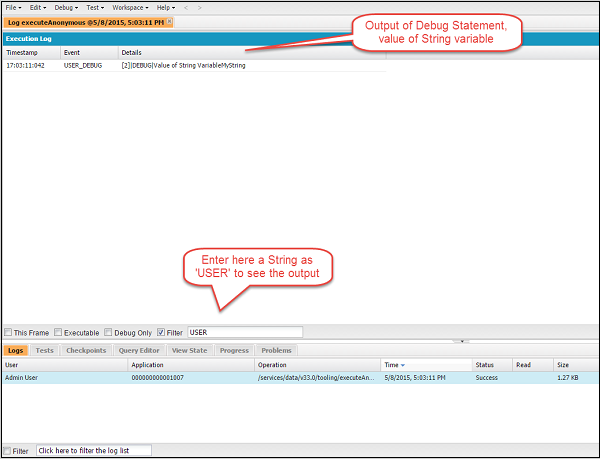
Then type 'USER' in the window as shown below and the output statement will appear in the debug window. This 'USER' statement is used for filtering the output.
So basically, you will be following all the above mentioned steps to execute any code snippet in this tutorial.
