
Article Categories
- All Categories
-
 Data Structure
-
 Networking
-
 RDBMS
RDBMS
-
 Operating System
-
 Java
Java
-
 MS Excel
-
 iOS
iOS
-
 HTML
HTML
-
 CSS
CSS
-
 Android
-
 Python
-
 C Programming
-
 C++
C++
-
 C#
C#
-
 MongoDB
-
 MySQL
MySQL
-
 Javascript
-
 PHP
PHP
-
 Economics & Finance
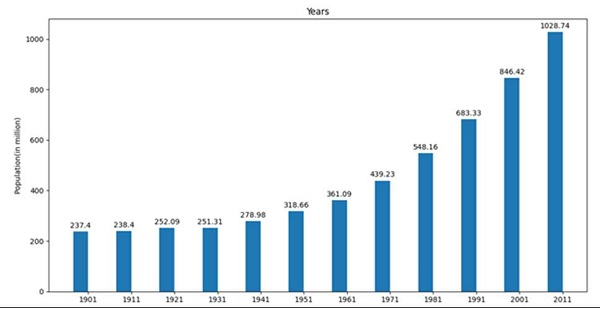
Adding value labels on a matplotlib bar chart
In this program, we can initialize some input values and then try to plot a bar using those values. We can instantiate a figure and axis so that we could set the label, ticks, and annotate the height and width of the bar.
Steps
Make a list of years.
Make a list of populations in that year.
Get the number of labels using np.arrange(len(years)) method.
Set the width of the bars.
Create fig and ax variables using subplots() method, where default nrows and ncols are 1.
Set the Y-axis label of the figure using set_ylabel().
Set the title of the figure, using set_title().
Set the X-ticks with x that is created in step 3, using set_xticks method.
Set the xtick_labels with years data, using set_xticklabels method.
Make a plot bar using ax.bar().
Iterate the bar container (from step 10) to annotate to set the value for every bars.
Use plt.show() to show the figure.
Example
from matplotlib import pyplot as plt
import numpy as np

years = [1901, 1911, 1921, 1931, 1941, 1951, 1961, 1971, 1981, 1991, 2001, 2011]
population = [237.4, 238.4, 252.09, 251.31, 278.98, 318.66, 361.09, 439.23, 548.16, 683.33, 846.42, 1028.74]

x = np.arange(len(years)) # the label locations
width = 0.35 # the width of the bars

fig, ax = plt.subplots()

ax.set_ylabel('Population(in million)')
ax.set_title('Years')
ax.set_xticks(x)
ax.set_xticklabels(years)

pps = ax.bar(x - width/2, population, width, label='population')
for p in pps:
   height = p.get_height()
   ax.annotate('{}'.format(height),
      xy=(p.get_x() + p.get_width() / 2, height),
      xytext=(0, 3), # 3 points vertical offset
      textcoords="offset points",
      ha='center', va='bottom')

plt.show()
Output

23K+ Views
