 Data Structure
 Networking
 RDBMS
RDBMS Operating System
 Java
Java MS Excel
 iOS
iOS HTML
HTML CSS
CSS Android
 Python
 C Programming
 C++
C++ C#
C# MongoDB
 MySQL
MySQL Javascript
 PHP
PHP
- Selected Reading
- UPSC IAS Exams Notes
- Developer's Best Practices
- Questions and Answers
- Effective Resume Writing
- HR Interview Questions
- Computer Glossary
- Who is Who
Understanding meshgrid () and contourf() Methods
Data analysis and understanding depend heavily on data visualization. There are several libraries available for the popular programming language Python that might aid with data visualization. Data scientists regularly use meshgrid() and contourf() to produce 2D and 3D graphs because they are excellent tools for facilitating the display of complicated data sets. For building point grids for various visualizations, like heat maps and contour plots, Meshgrid() is a very useful method. We will talk about two crucial methods in this blog post: meshgrid() and contourf (). These methods are essential for two-dimensional visualization of three-dimensional data.
What is Meshgrid()?
Meshgrid() is a function that produces a grid of coordinates for plotting a function on a 2D or 3D display. The meshgrid() function, which needs two 1D arrays, returns the X and Y coordinates of each point in the grid in two 2D arrays. When creating visualizations like heat maps and contour plots, which require the creation of a grid of points, this technique is highly useful. Data scientists can utilize the potent function meshgrid() to display vast, complex data sets in order to find patterns and trends that might not be immediately apparent from raw data or tables.
The meshgrid() function's syntax is as follows ?
X, Y = np.meshgrid(x, y)
The X and Y coordinates of each point on the grid may be represented by 2D arrays that we can build. The 1D arrays X and Y can be concatenated to achieve this.
Now, we also need to produce the Z coordinate for each grid point if we want to see this grid in three dimensions. To do this, we can utilize a function that will assign each point coordinates that match the X, Y, and Z values. We can produce spectacular visualizations that truly bring our data to life using these 3D coordinates.
Example
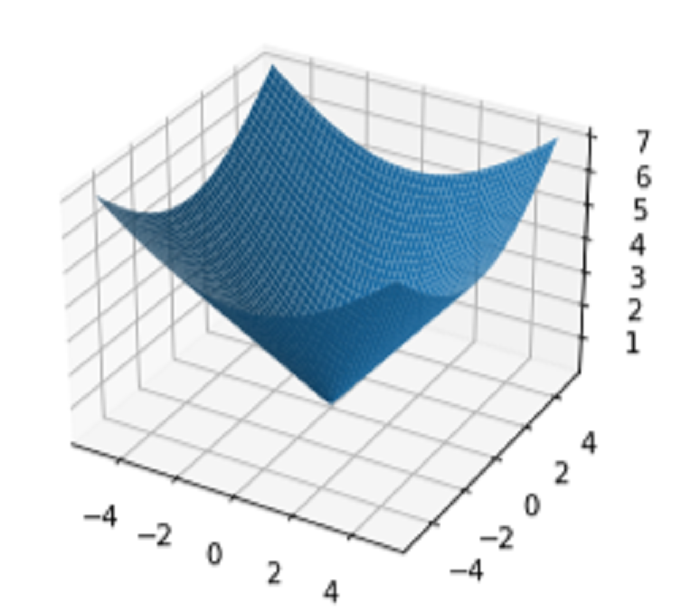
In the following example, we first create two 1D arrays called x and y using the linspace() method. After we have these arrays, we will utilize them to create a coordinate grid using the meshgrid method ().
The Z coordinates for each grid point will be stored in an array we build next named Z. Lastly, we can visualize this data in three dimensions by using the plot surface() method. It's a fantastic approach to learn more about your data's current state and grid-wide distribution.
import numpy as np
import matplotlib.pyplot as plt

x = np.linspace(-5, 5, 100)
y = np.linspace(-5, 5, 100)
X, Y = np.meshgrid(x, y)
Z = np.sqrt(X**2 + Y**2)

fig = plt.figure()
ax = fig.add_subplot(projection='3d')
ax.plot_surface(X, Y, Z)
plt.show()
Output

What is Contourf()?
Contourf() is a common method for creating filled contour charts in data visualization. It is a component of the matplotlib package that enables us to produce fluid 2D representations of 3D data. This technique displays a succession of contour lines that correlate to certain data values, making it very helpful for spotting patterns and trends in the data. We can immediately and readily recognize areas with comparable values since the filled regions between the contour lines are tinted with various hues. Because of this, contourf() is a useful tool for perusing and comprehending complicated datasets. It is also quite flexible, enabling users to change elements like the quantity of contour lines and the color scheme employed to depict the data.
The contourf() function's syntax is as follows ?
plt.contourf(X, Y, Z)
Where X and Y are the data's X and Y coordinates, and Z is its Z values. The function contourf() plots the data as a filled contour.
Example
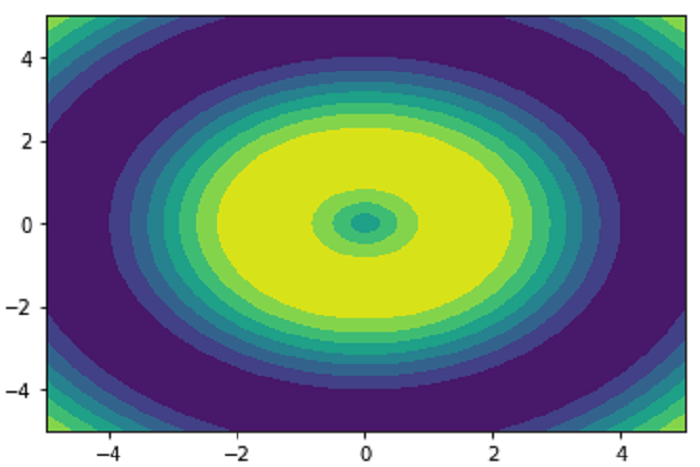
In the first step in this example we're looking at it to create the x and y arrays using the linspace() method. Next, depending on these arrays, the meshgrid() method creates a grid of coordinates. We build the Z coordinates for each point and then put them in a Z array after we have the grid.
The data is finally shown in 2D using the contourf() function. By connecting points with the same data value with a sequence of contour lines and filling the spaces in between the lines with various colors, this technique makes it easier to see patterns in the data. It can be a potent tool for exploring and analyzing complicated datasets and is a particularly effective approach to obtain a feel of the overall form and structure of our data.
import numpy as np
import matplotlib.pyplot as plt

x = np.linspace(-5, 5, 100)
y = np.linspace(-5, 5, 100)
X, Y = np.meshgrid(x, y)
Z = np.sin(np.sqrt(X**2 + Y**2))

plt.contourf(X, Y, Z)
plt.show()
Output

Conclusion
In conclusion, every data analyst or scientist can benefit from having a solid grasp of the meshgrid() and contourf() algorithms. These routines offer a straightforward yet effective method for two- and three-dimensional visualization of complicated data. Although contourf() generates a full contour plot that represents the 2D projection of 3D data, meshgrid() permits the development of a grid of coordinates for visualizing functions on a 2D or 3D plot. Data analysts and scientists may quickly produce attractive representations of their data with these methods, making it simpler to comprehend and analyze. Ultimately, meshgrid() and contourf() are critical tools in the toolkit of the data analyst and should be fully utilized to elicit insights from complicated data.

