- Project Management Home
- Activity Based Costing
- Agile Project Management
- Basic Management Skills
- Basic Quality Tools
- Benchmarking Process
- Cause and Effect Diagram
- Change Management Process
- Communication Blockers
- Communication Channels
- Communication Methods
- Communication Models
- Communications Management
- Conflict Management
- Crisis Management
- Critical Chain Scheduling
- Critical Path Method
- Decision Making Process
- Design of Experiment
- Effective Communication Skills
- Effective Presentation Skills
- Enterprise Resource Planning
- Event Chain Methodology
- Extreme Project Management
- Gantt Chart Tool
- Just-In-Time Manufacturing
- Knowledge Management
- Leads, Lags and Floats
- Management Best Practices
- Management Styles
- Management by Objectives
- Monte Carlo Analysis
- Motivation Theories
- Negotiation Skills
- Organizational Structures
- PERT Estimation Technique
- PRINCE2 Project Methodology
- Pareto Chart Tool
- Powerful Leadership Skills
- Process Based Management
- Procurement Documents
- Procurement Management
- Project Activity Diagram
- Project Charter
- Project Contract Types
- Project Cost Control
- Project Kick-off Meeting
- Project Lessons Learned
- Project Management Methodologies
- Project Management Office
- Project Management Processes
- Project Management Tools
- Project Management Triangle
- Project Manager Goals
- Project Portfolio Management
- Project Quality Plan
- Project Records Management
- Project Risk Categories
- Project Risk Management
- Project Scope Definition
- Project Selection Method
- Project Success Criteria
- Project Time Management
- Project Workforce Management
- Project Management Softwares
- QC and QA Processes
- RACI Chart Tool
- Recognition and Rewards
- Requirement Collection
- Resource Leveling
- Staffing Management Plan
- Stakeholder Management
- Statement of Work (SOW)
- Stress Management Techniques
- Structured Brainstorming
- Succession Planning
- Supply Chain Management
- Team Building Program
- Team Motivation
- The Balanced Scorecard
- The Halo Effect
- The Make or Buy Decision
- The Rule of Seven
- The Virtual Team
- Total Productive Maintenance
- Total Quality Management
- Traditional Project Management
- Work Breakdown Structure
Basic Quality Tools
Introduction
Most organizations use quality tools for various purposes related to controlling and assuring quality.
Although a good number of quality tools specific are available for certain domains, fields and practices, some of the quality tools can be used across such domains. These quality tools are quite generic and can be applied to any condition.
There are seven basic quality tools used in organizations. These tools can provide much information about problems in the organization assisting to derive solutions for the same.
A number of these quality tools come with a price tag. A brief training, mostly a self-training, is sufficient for someone to start using the tools.
Let us have a look at the seven basic quality tools in brief.
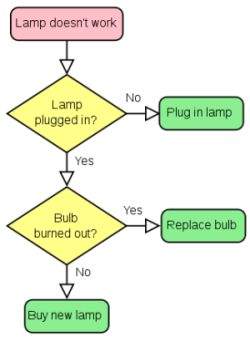
1. Flow Charts
This is one of the basic quality tool that can be used for analyzing a sequence of events.
The tool maps out a sequence of events that take place sequentially or in parallel. The flow chart can be used to understand a complex process in order to find the relationships and dependencies between events.
You can also get a brief idea about the critical path of the process and the events involved in the critical path.
Flow charts can be used for any field to illustrate complex processes in a simple way. There are specific software tools developed for drawing flow charts, such as MS Visio.
You can download some of the open source flow chart tools developed by the open source community.
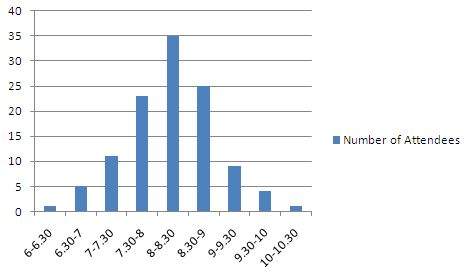
2. Histogram
Histogram is used for illustrating the frequency and the extent in the context of two variables.
Histogram is a chart with columns. This represents the distribution by mean. If the histogram is normal, the graph takes the shape of a bell curve.
If it is not normal, it may take different shapes based on the condition of the distribution. Histogram can be used to measure something against another thing. Always, it should be two variables.
Consider the following example: The following histogram shows morning attendance of a class. The X-axis is the number of students and the Y-axis the time of the day.
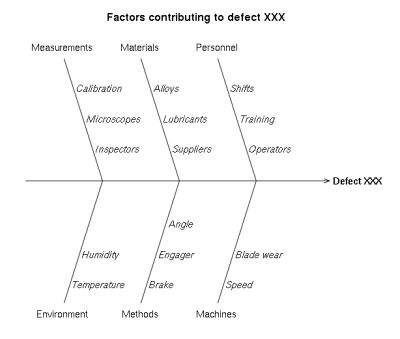
3. Cause and Effect Diagram
Cause and effect diagrams (Ishikawa Diagram) are used for understanding organizational or business problem causes.
Organizations face problems everyday and it is required to understand the causes of these problems in order to solve them effectively. Cause and effect diagrams exercise is usually a teamwork.
A brainstorming session is required in order to come up with an effective cause and effect diagram.
All the main components of a problem area are listed and possible causes from each area is listed.
Then, most likely causes of the problems are identified to carry out further analysis.
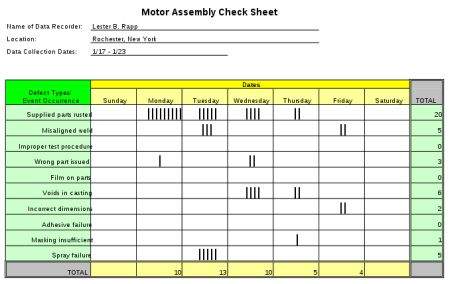
4. Check Sheet
A check sheet can be introduced as the most basic tool for quality.
A check sheet is basically used for gathering and organizing data.
When this is done with the help of software packages such as Microsoft Excel, you can derive further analysis graphs and automate through macros available.
Therefore, it is always a good idea to use a software check sheet for information gathering and organizing needs.
One can always use a paper-based check sheet when the information gathered is only used for backup or storing purposes other than further processing.
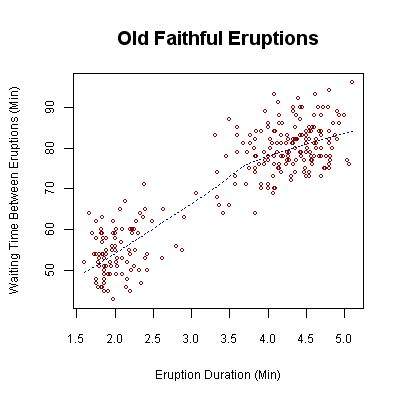
5. Scatter Diagram
When it comes to the values of two variables, scatter diagrams are the best way to present. Scatter diagrams present the relationship between two variables and illustrate the results on a Cartesian plane.
Then, further analysis, such as trend analysis can be performed on the values.
In these diagrams, one variable denotes one axis and another variable denotes the other axis.
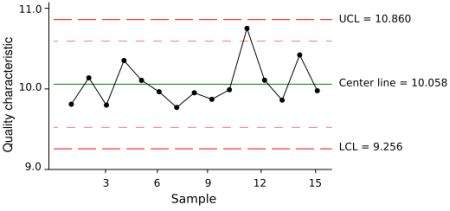
6. Control Charts
Control chart is the best tool for monitoring the performance of a process. These types of charts can be used for monitoring any processes related to function of the organization.
These charts allow you to identify the following conditions related to the process that has been monitored.
Stability of the process
Predictability of the process
Identification of common cause of variation
Special conditions where the monitoring party needs to react
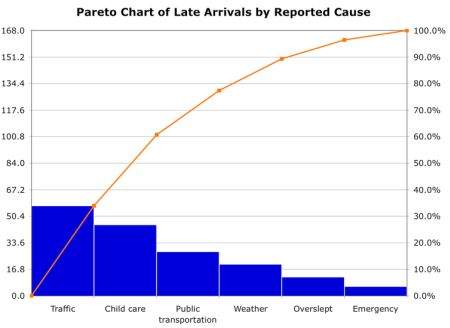
7. Pareto Charts
Pareto charts are used for identifying a set of priorities. You can chart any number of issues/variables related to a specific concern and record the number of occurrences.
This way you can figure out the parameters that have the highest impact on the specific concern.
This helps you to work on the propriety issues in order to get the condition under control.
Conclusion
Above seven basic quality tools help you to address different concerns in an organization.
Therefore, use of such tools should be a basic practice in the organization in order to enhance the efficiency.
Trainings on these tools should be included in the organizational orientation program, so all the staff members get to learn these basic tools.
