- OpenCV - Home
- OpenCV - Overview
- OpenCV - Environment
- OpenCV - Storing Images
- OpenCV - Reading Images
- OpenCV - Writing an Image
- OpenCV - GUI
- Image Conversion
- Colored Images to GrayScale
- OpenCV - Colored Image to Binary
- OpenCV - Grayscale to Binary
- Drawing Functions
- OpenCV - Drawing a Circle
- OpenCV - Drawing a Line
- OpenCV - Drawing a Rectangle
- OpenCV - Drawing an Ellipse
- OpenCV - Drawing Polylines
- OpenCV - Drawing Convex Polylines
- OpenCV - Drawing Arrowed Lines
- OpenCV - Adding Text
- Filtering
- OpenCV - Bilateral Filter
- OpenCV - Box Filter
- OpenCV - SQRBox Filter
- OpenCV - Filter2D
- OpenCV - Dilation
- OpenCV - Erosion
- OpenCV - Morphological Operations
- OpenCV - Image Pyramids
- Sobel Derivatives
- OpenCV - Sobel Operator
- OpenCV - Scharr Operator
- Transformation Operations
- OpenCV - Laplacian Transformation
- OpenCV - Distance Transformation
- Camera and Face Detection
- OpenCV - Using Camera
- OpenCV - Face Detection in a Picture
- Face Detection using Camera
- Geometric Transformations
- OpenCV - Affine Translation
- OpenCV - Rotation
- OpenCV - Scaling
- OpenCV - Color Maps
- Miscellaneous Chapters
- OpenCV - Canny Edge Detection
- OpenCV - Hough Line Transform
- OpenCV - Histogram Equalization
- OpenCV Useful Resources
- OpenCV - Quick Guide
- OpenCV - Cheatsheet
- OpenCV - Useful Resources
- OpenCV - Discussion
OpenCV - Colored Images to GrayScale
In the earlier chapters, we discussed how to read an input image as different types (binary, grayscale, BGR, etc.). In this chapter, we will learn how to convert one type of image to another.
The class named Imgproc of the package org.opencv.imgproc provides methods to convert an image from one color to another.
Converting Colored Images to Grayscale
A method named cvtColor() is used to convert colored images to grayscale. Following is the syntax of this method.
cvtColor(Mat src, Mat dst, int code)
This method accepts the following parameters −
src − A matrix representing the source.
dst − A matrix representing the destination.
code − An integer code representing the type of the conversion, for example, RGB to Grayscale.
You can convert colored images to gray scale by passing the code Imgproc.COLOR_RGB2GRAY along with the source and destination matrices as a parameter to the cvtColor() method.
Example
The following program demonstrates how to read a colored image as a grayscale image and display it using JavaFX window.
import java.awt.image.BufferedImage;

import org.opencv.core.Core;
import org.opencv.core.Mat;
import org.opencv.imgcodecs.Imgcodecs;
import org.opencv.imgproc.Imgproc;

import javafx.application.Application;
import javafx.embed.swing.SwingFXUtils;
import javafx.scene.Group;
import javafx.scene.Scene;
import javafx.scene.image.ImageView;
import javafx.scene.image.WritableImage;

import javafx.stage.Stage;

public class ColorToGrayscale extends Application {
   @Override
   public void start(Stage stage) throws Exception {
      WritableImage writableImage = loadAndConvert();

      // Setting the image view
      ImageView imageView = new ImageView(writableImage);

      // Setting the position of the image
      imageView.setX(10);
      imageView.setY(10);

      // setting the fit height and width of the image view
      imageView.setFitHeight(400);
      imageView.setFitWidth(600);

      // Setting the preserve ratio of the image view
      imageView.setPreserveRatio(true);

      // Creating a Group object
      Group root = new Group(imageView);

      // Creating a scene object
      Scene scene = new Scene(root, 600, 400);

      // Setting title to the Stage
      stage.setTitle("Colored to grayscale image");

      // Adding scene to the stage
      stage.setScene(scene);

      // Displaying the contents of the stage
      stage.show();
   }
   public WritableImage loadAndConvert() throws Exception {
      //Loading the OpenCV core library
      System.loadLibrary( Core.NATIVE_LIBRARY_NAME );

      String input = "C:/EXAMPLES/OpenCV/sample.jpg";

      //Reading the image
      Mat src = Imgcodecs.imread(input);

      //Creating the empty destination matrix
      Mat dst = new Mat();

      //Converting the image to gray sacle and saving it in the dst matrix
      Imgproc.cvtColor(src, dst, Imgproc.COLOR_RGB2GRAY);

      //Extracting data from the transformed image (dst)
      byte[] data1 = new byte[dst.rows() * dst.cols() * (int)(dst.elemSize())];
      dst.get(0, 0, data1);

      //Creating Buffered image using the data
      BufferedImage bufImage = new BufferedImage(dst.cols(),dst.rows(),
         BufferedImage.TYPE_BYTE_GRAY);

      //Setting the data elements to the image
      bufImage.getRaster().setDataElements(0, 0, dst.cols(), dst.rows(), data1);

      //Creating a WritableImage
      WritableImage writableImage = SwingFXUtils.toFXImage(bufImage, null);
      System.out.println("Converted to Grayscale");
      return writableImage;
   }
   public static void main(String args[]) throws Exception {
      launch(args);
   }
}
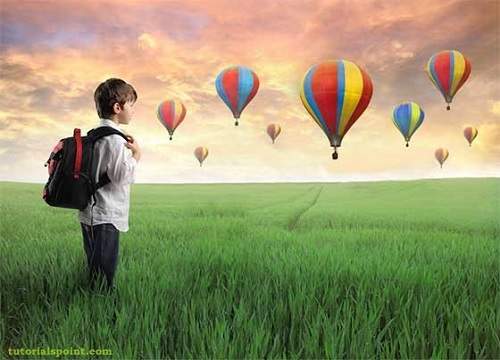
Input Image
Assume that following is the input image sample.jpg specified in the above program.
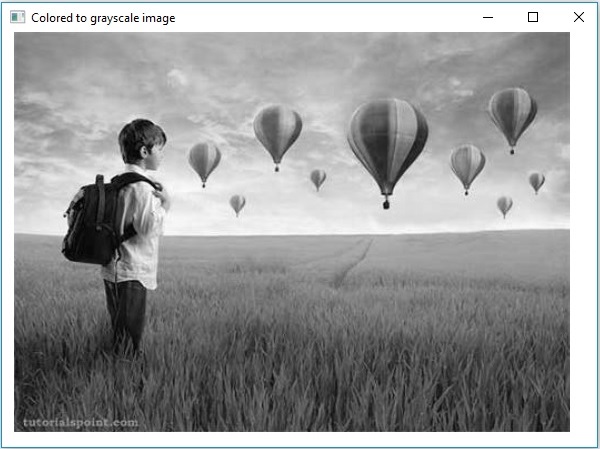
Output Image
On executing the program, you will get the following output.