- SciPy - Home
- SciPy - Introduction
- SciPy - Environment Setup
- SciPy - Basic Functionality
- SciPy - Relationship with NumPy
- SciPy Clusters
- SciPy - Clusters
- SciPy - Hierarchical Clustering
- SciPy - K-means Clustering
- SciPy - Distance Metrics
- SciPy Constants
- SciPy - Constants
- SciPy - Mathematical Constants
- SciPy - Physical Constants
- SciPy - Unit Conversion
- SciPy - Astronomical Constants
- SciPy - Fourier Transforms
- SciPy - FFTpack
- SciPy - Discrete Fourier Transform (DFT)
- SciPy - Fast Fourier Transform (FFT)
- SciPy Integration Equations
- SciPy - Integrate Module
- SciPy - Single Integration
- SciPy - Double Integration
- SciPy - Triple Integration
- SciPy - Multiple Integration
- SciPy Differential Equations
- SciPy - Differential Equations
- SciPy - Integration of Stochastic Differential Equations
- SciPy - Integration of Ordinary Differential Equations
- SciPy - Discontinuous Functions
- SciPy - Oscillatory Functions
- SciPy - Partial Differential Equations
- SciPy Interpolation
- SciPy - Interpolate
- SciPy - Linear 1-D Interpolation
- SciPy - Polynomial 1-D Interpolation
- SciPy - Spline 1-D Interpolation
- SciPy - Grid Data Multi-Dimensional Interpolation
- SciPy - RBF Multi-Dimensional Interpolation
- SciPy - Polynomial & Spline Interpolation
- SciPy Curve Fitting
- SciPy - Curve Fitting
- SciPy - Linear Curve Fitting
- SciPy - Non-Linear Curve Fitting
- SciPy - Input & Output
- SciPy - Input & Output
- SciPy - Reading & Writing Files
- SciPy - Working with Different File Formats
- SciPy - Efficient Data Storage with HDF5
- SciPy - Data Serialization
- SciPy Linear Algebra
- SciPy - Linalg
- SciPy - Matrix Creation & Basic Operations
- SciPy - Matrix LU Decomposition
- SciPy - Matrix QU Decomposition
- SciPy - Singular Value Decomposition
- SciPy - Cholesky Decomposition
- SciPy - Solving Linear Systems
- SciPy - Eigenvalues & Eigenvectors
- SciPy Image Processing
- SciPy - Ndimage
- SciPy - Reading & Writing Images
- SciPy - Image Transformation
- SciPy - Filtering & Edge Detection
- SciPy - Top Hat Filters
- SciPy - Morphological Filters
- SciPy - Low Pass Filters
- SciPy - High Pass Filters
- SciPy - Bilateral Filter
- SciPy - Median Filter
- SciPy - Non - Linear Filters in Image Processing
- SciPy - High Boost Filter
- SciPy - Laplacian Filter
- SciPy - Morphological Operations
- SciPy - Image Segmentation
- SciPy - Thresholding in Image Segmentation
- SciPy - Region-Based Segmentation
- SciPy - Connected Component Labeling
- SciPy Optimize
- SciPy - Optimize
- SciPy - Special Matrices & Functions
- SciPy - Unconstrained Optimization
- SciPy - Constrained Optimization
- SciPy - Matrix Norms
- SciPy - Sparse Matrix
- SciPy - Frobenius Norm
- SciPy - Spectral Norm
- SciPy Condition Numbers
- SciPy - Condition Numbers
- SciPy - Linear Least Squares
- SciPy - Non-Linear Least Squares
- SciPy - Finding Roots of Scalar Functions
- SciPy - Finding Roots of Multivariate Functions
- SciPy - Signal Processing
- SciPy - Signal Filtering & Smoothing
- SciPy - Short-Time Fourier Transform
- SciPy - Wavelet Transform
- SciPy - Continuous Wavelet Transform
- SciPy - Discrete Wavelet Transform
- SciPy - Wavelet Packet Transform
- SciPy - Multi-Resolution Analysis
- SciPy - Stationary Wavelet Transform
- SciPy - Statistical Functions
- SciPy - Stats
- SciPy - Descriptive Statistics
- SciPy - Continuous Probability Distributions
- SciPy - Discrete Probability Distributions
- SciPy - Statistical Tests & Inference
- SciPy - Generating Random Samples
- SciPy - Kaplan-Meier Estimator Survival Analysis
- SciPy - Cox Proportional Hazards Model Survival Analysis
- SciPy Spatial Data
- SciPy - Spatial
- SciPy - Special Functions
- SciPy - Special Package
- SciPy Advanced Topics
- SciPy - CSGraph
- SciPy - ODR
- SciPy Useful Resources
- SciPy - Reference
- SciPy - Quick Guide
- SciPy - Cheatsheet
- SciPy - Useful Resources
- SciPy - Discussion
SciPy - face() Method
The SciPy face() method is used to get the images of a racoon. This method also applied to various application such as edge detection, filtering and transformation.
Syntax
Following is the syntax of the SciPy method −
face()
Parameters
This method does not take any parameter.
Return value
This method returns the image of a racoon face.
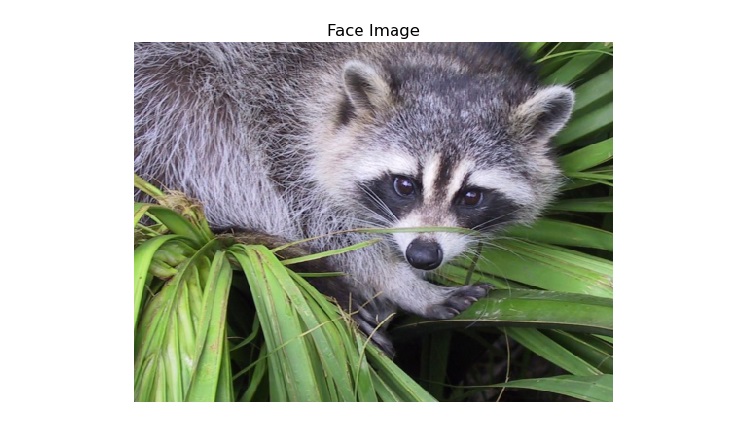
Example 1
Following is the basic example of SciPy face() method illustrates the face of racoon.
import matplotlib.pyplot as plt
from scipy.misc import face

# load the face image
image = face()

# display the image using matplotlib
plt.imshow(image)
plt.title('Face Image')
plt.axis('off')
plt.show()
Output
The above code produces the following output −
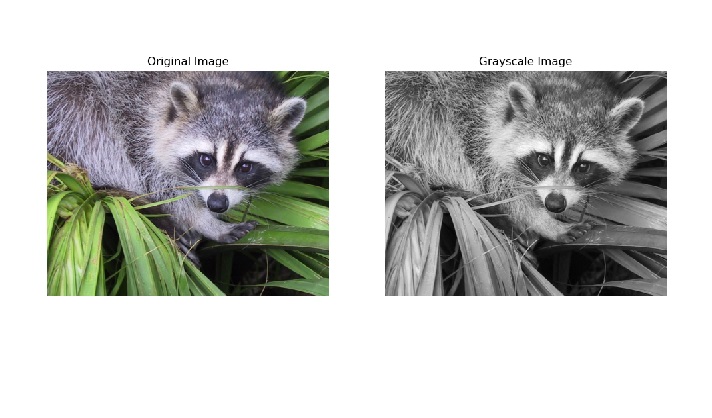
Example 2
Here, we convert the original(face) image into gray-scale using the weighted sum of RGB components. Thus, it displayed both images in parallel mode.
import matplotlib.pyplot as plt
from scipy.misc import face
import numpy as np

# load the face image
image = face()

# convert the image to grayscale
gray_image = np.dot(image[..., :3], [0.299, 0.587, 0.114])

# display the original and grayscale images
fig, axes = plt.subplots(1, 2, figsize=(12, 6))
axes[0].imshow(image)
axes[0].set_title('Original Image')
axes[0].axis('off')

axes[1].imshow(gray_image, cmap='gray')
axes[1].set_title('Grayscale Image')
axes[1].axis('off')

plt.show()
Output
The above code produces the following output −
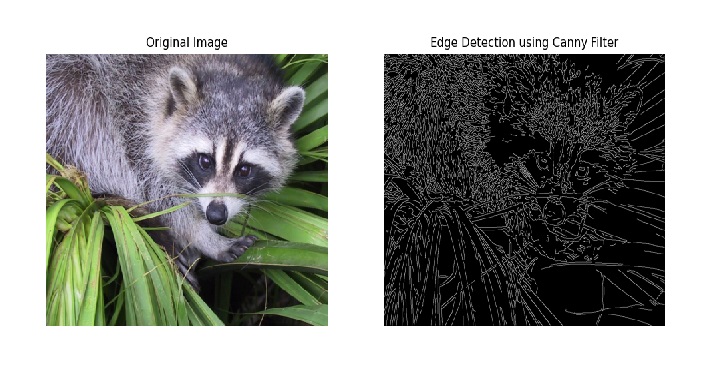
Example 3
To obtain the edge detection image, it uses two axes(0 and 1) to determine all its behaviors and in the same way, it applies a canny filter(cmap = 'gray') to another axis and shows the result side by side.
import matplotlib.pyplot as plt
from scipy.misc import face
from skimage.color import rgb2gray
from skimage.feature import canny

# load the face image
image = face()

# convert the image to grayscale
gray_image = rgb2gray(image)

# apply the Canny edge detector
edges = canny(gray_image, sigma=2)

# display the original and edge-detected images
fig, axes = plt.subplots(1, 2, figsize=(12, 6))

# first axes
axes[0].imshow(image)
axes[0].set_title('Original Image')
axes[0].axis('off')

# Second axes
axes[1].imshow(edges, cmap='gray')
axes[1].set_title('Edge Detection using Canny Filter')
axes[1].axis('off')

plt.show()
Output
The above code produces the following output −