- SciPy - Home
- SciPy - Introduction
- SciPy - Environment Setup
- SciPy - Basic Functionality
- SciPy - Relationship with NumPy
- SciPy Clusters
- SciPy - Clusters
- SciPy - Hierarchical Clustering
- SciPy - K-means Clustering
- SciPy - Distance Metrics
- SciPy Constants
- SciPy - Constants
- SciPy - Mathematical Constants
- SciPy - Physical Constants
- SciPy - Unit Conversion
- SciPy - Astronomical Constants
- SciPy - Fourier Transforms
- SciPy - FFTpack
- SciPy - Discrete Fourier Transform (DFT)
- SciPy - Fast Fourier Transform (FFT)
- SciPy Integration Equations
- SciPy - Integrate Module
- SciPy - Single Integration
- SciPy - Double Integration
- SciPy - Triple Integration
- SciPy - Multiple Integration
- SciPy Differential Equations
- SciPy - Differential Equations
- SciPy - Integration of Stochastic Differential Equations
- SciPy - Integration of Ordinary Differential Equations
- SciPy - Discontinuous Functions
- SciPy - Oscillatory Functions
- SciPy - Partial Differential Equations
- SciPy Interpolation
- SciPy - Interpolate
- SciPy - Linear 1-D Interpolation
- SciPy - Polynomial 1-D Interpolation
- SciPy - Spline 1-D Interpolation
- SciPy - Grid Data Multi-Dimensional Interpolation
- SciPy - RBF Multi-Dimensional Interpolation
- SciPy - Polynomial & Spline Interpolation
- SciPy Curve Fitting
- SciPy - Curve Fitting
- SciPy - Linear Curve Fitting
- SciPy - Non-Linear Curve Fitting
- SciPy - Input & Output
- SciPy - Input & Output
- SciPy - Reading & Writing Files
- SciPy - Working with Different File Formats
- SciPy - Efficient Data Storage with HDF5
- SciPy - Data Serialization
- SciPy Linear Algebra
- SciPy - Linalg
- SciPy - Matrix Creation & Basic Operations
- SciPy - Matrix LU Decomposition
- SciPy - Matrix QU Decomposition
- SciPy - Singular Value Decomposition
- SciPy - Cholesky Decomposition
- SciPy - Solving Linear Systems
- SciPy - Eigenvalues & Eigenvectors
- SciPy Image Processing
- SciPy - Ndimage
- SciPy - Reading & Writing Images
- SciPy - Image Transformation
- SciPy - Filtering & Edge Detection
- SciPy - Top Hat Filters
- SciPy - Morphological Filters
- SciPy - Low Pass Filters
- SciPy - High Pass Filters
- SciPy - Bilateral Filter
- SciPy - Median Filter
- SciPy - Non - Linear Filters in Image Processing
- SciPy - High Boost Filter
- SciPy - Laplacian Filter
- SciPy - Morphological Operations
- SciPy - Image Segmentation
- SciPy - Thresholding in Image Segmentation
- SciPy - Region-Based Segmentation
- SciPy - Connected Component Labeling
- SciPy Optimize
- SciPy - Optimize
- SciPy - Special Matrices & Functions
- SciPy - Unconstrained Optimization
- SciPy - Constrained Optimization
- SciPy - Matrix Norms
- SciPy - Sparse Matrix
- SciPy - Frobenius Norm
- SciPy - Spectral Norm
- SciPy Condition Numbers
- SciPy - Condition Numbers
- SciPy - Linear Least Squares
- SciPy - Non-Linear Least Squares
- SciPy - Finding Roots of Scalar Functions
- SciPy - Finding Roots of Multivariate Functions
- SciPy - Signal Processing
- SciPy - Signal Filtering & Smoothing
- SciPy - Short-Time Fourier Transform
- SciPy - Wavelet Transform
- SciPy - Continuous Wavelet Transform
- SciPy - Discrete Wavelet Transform
- SciPy - Wavelet Packet Transform
- SciPy - Multi-Resolution Analysis
- SciPy - Stationary Wavelet Transform
- SciPy - Statistical Functions
- SciPy - Stats
- SciPy - Descriptive Statistics
- SciPy - Continuous Probability Distributions
- SciPy - Discrete Probability Distributions
- SciPy - Statistical Tests & Inference
- SciPy - Generating Random Samples
- SciPy - Kaplan-Meier Estimator Survival Analysis
- SciPy - Cox Proportional Hazards Model Survival Analysis
- SciPy Spatial Data
- SciPy - Spatial
- SciPy - Special Functions
- SciPy - Special Package
- SciPy Advanced Topics
- SciPy - CSGraph
- SciPy - ODR
- SciPy Useful Resources
- SciPy - Reference
- SciPy - Quick Guide
- SciPy - Cheatsheet
- SciPy - Useful Resources
- SciPy - Discussion
SciPy - set_link_color_palette(s) Method
The SciPy set_link_color_palette() Method is used to perform the operation of matplotlib color codes. It allows user to set the customize colors while representing the different clusters in a dendrogram. This method is part of the scipy.cluster.hierarchy module.
Following are the usage of this method used in data analysis −
- Hierarchical Clustering Visualization: This shows data of different colors for different clusters.
- Data Presentation: Data are more readable and visual appealing for the representation.
- Pattern Recognition: This helps us for the identification of clusters and relationship with a larger datasets.
Syntax
Following is the syntax of the SciPy set_link_color_palette() Method −
set_link_color_palette(['color_code_1', 'color_code_2', ...])
Parameters
This method accepts the custom color palette based on data inputs.
Return value
This method doesn't return any type.
Example 1
Following is the SciPy set_link_color_palette() Method that illustrates the different color palette within a given input data.
import numpy as np
import matplotlib.pyplot as plt
from scipy.cluster.hierarchy import dendrogram, linkage, set_link_color_palette

# given data
X = np.array([[1, 2], [3, 4], [5, 6], [7, 8], [9, 10]])

# hierarchical/agglomerative clustering
res = linkage(X, 'ward')

# set the custom color palette
set_link_color_palette(['r', 'g', 'b', 'c', 'm', 'y'])

# Plot dendrogram
dendrogram(res)
plt.show()
Output
The above code produces the following output −

Example 2
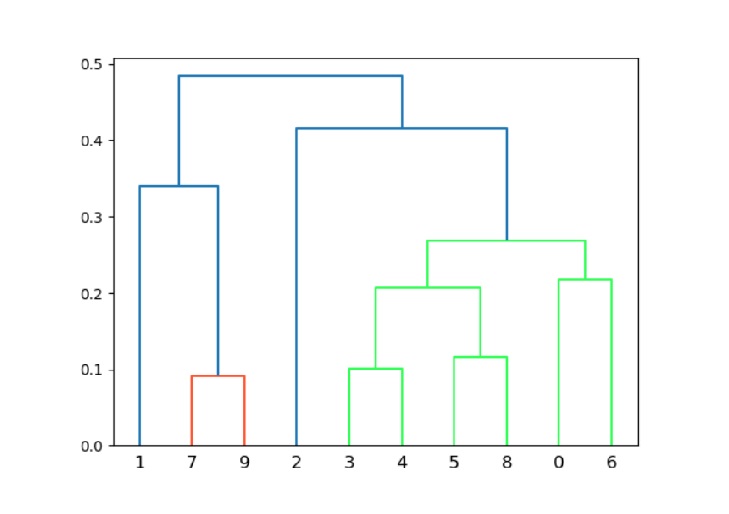
Here, we are using random.rand() to set the given data and shows color palette with the help of hexadecimal color codes(eg. #33FF57).
import numpy as np
import matplotlib.pyplot as plt
from scipy.cluster.hierarchy import dendrogram, linkage, set_link_color_palette

# given data
X = np.random.rand(10, 2)

# hierarchical/agglomerative clustering
res = linkage(X, 'single')

# set a custom color palette using hexadecimal color codes
set_link_color_palette(['#FF5733', '#33FF57', '#3357FF', '#FF33A1'])

# plot dendrogram
dendrogram(res)
plt.show()
Output
The above code produces the following output −
Example 3
Below the program demonstrates the color palette for a larger dataset using set_link_color_palette().
import numpy as np
import matplotlib.pyplot as plt
from scipy.cluster.hierarchy import dendrogram, linkage, set_link_color_palette

# given data
X = np.random.rand(50, 2)

# hierarchical/agglomerative clustering
res = linkage(X, 'complete')

# set a larger custom color palette
palette = ['#FF0000', '#00FF00', '#0000FF', '#FFFF00', '#FF00FF', '#00FFFF',
           '#800000', '#808000', '#008000', '#800080', '#008080', '#000080']
set_link_color_palette(palette)

# plot dendrogram
dendrogram(res)
plt.show()
Output
The above code produces the following output −

