 Data Structure
 Networking
 RDBMS
RDBMS Operating System
 Java
Java MS Excel
 iOS
iOS HTML
HTML CSS
CSS Android
 Python
 C Programming
 C++
C++ C#
C# MongoDB
 MySQL
MySQL Javascript
 PHP
PHP
- Selected Reading
- UPSC IAS Exams Notes
- Developer's Best Practices
- Questions and Answers
- Effective Resume Writing
- HR Interview Questions
- Computer Glossary
- Who is Who
Rotating axis text for each subplot in Matplotlib
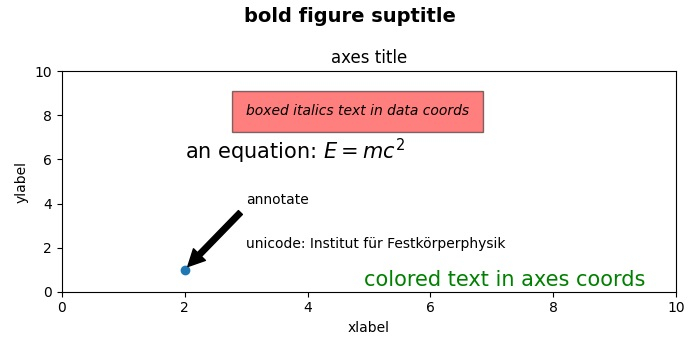
To rotate axis text for each subplot, we can use text with rotation in the argument.
Steps
Create a new figure or activate an existing figure.
Add an '~.axes.Axes' to the figure as part of a subplot arrangement using add_subplot() method.
Adjust the subplot layout parameters using subplots_adjust() method.
Add a centered title to the figure using suptitle() method.
Set the title of the axis.
Set the x and y label of the plot.
Create the axis with some co-ordinate points.
Add text to the figure with some arguments like fontsize, fontweight and add rotation.
Plot a single point and annotate that point with some text and arrowhead.
To display the figure, use show() method.
Example
from matplotlib import pyplot as plt
plt.rcParams["figure.figsize"] = [7.00, 3.50]
plt.rcParams["figure.autolayout"] = True
fig = plt.figure()
ax = fig.add_subplot()
fig.subplots_adjust(top=0.85)
fig.suptitle('bold figure suptitle', fontsize=14, fontweight='bold')
ax.set_title('axes title')
ax.set_xlabel('xlabel')
ax.set_ylabel('ylabel')
ax.axis([0, 10, 0, 10])
ax.text(3, 8, 'boxed italics text in data coords', style='italic',
   bbox={'facecolor': 'red', 'alpha': 0.5, 'pad': 10})
ax.text(2, 6, r'an equation: $E=mc^2$', fontsize=15)
ax.text(3, 2, 'unicode: Institut für Festkörperphysik')
ax.text(0.95, 0.01, 'colored text in axes coords',
   verticalalignment='bottom', horizontalalignment='right',
   transform=ax.transAxes,
   color='green', fontsize=15)
ax.plot([2], [1], 'o')
ax.annotate('annotate', xy=(2, 1), xytext=(3, 4),
   arrowprops=dict(facecolor='black', shrink=0.05))
plt.show()
Output


Advertisements
