
 Data Structure
 Networking
 RDBMS
RDBMS Operating System
 Java
Java MS Excel
 iOS
iOS HTML
HTML CSS
CSS Android
 Python
 C Programming
 C++
C++ C#
C# MongoDB
 MySQL
MySQL Javascript
 PHP
PHP
- Selected Reading
- UPSC IAS Exams Notes
- Developer's Best Practices
- Questions and Answers
- Effective Resume Writing
- HR Interview Questions
- Computer Glossary
- Who is Who
Representing voxels with matplotlib
In 3D computer graphics, a voxel represents a value on a regular grid in three-dimensional space. We can say a voxel is a 3D equivalent of a pixel that is used in 2D. A pixel is a square inside of a 2D image with a position in a 2D grid and a single color value, whereas a voxel is a cube inside of a 3D model with a position inside a 3D grid and a single color value.
To represent voxels with matplotlib, we can take the following steps −
Steps
Set the figure size and adjust the padding between and around the subplots.
Create random choice data points between 0 and 1.
Create a new figure or activate an existing figure.
Get the current axes, creating one if necessary, with projection='3d'.
Plot a set of filled voxels, using voxels() method.
To display the figure, use show() method.
Example
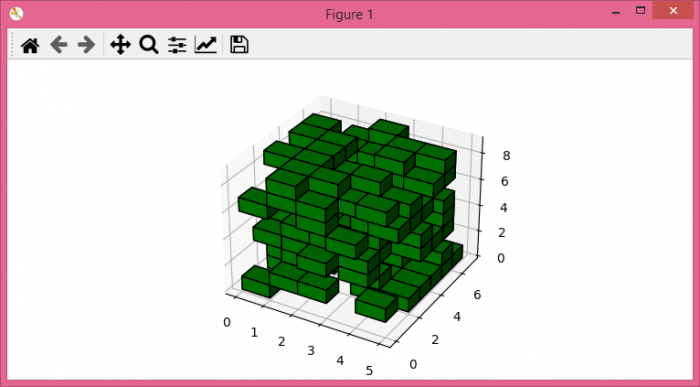
import numpy as np
import matplotlib.pyplot as plt

# Set the figure size
plt.rcParams["figure.figsize"] = [7.50, 3.50]
plt.rcParams["figure.autolayout"] = True

# Random data points between 0 and 1
data = np.random.choice([0, 1], size=(5, 7, 9), p=[0.65, 0.35])

# Create a new figure
fig = plt.figure()

# Axis with 3D projection
ax = fig.gca(projection='3d')

# Plot the voxels
ax.voxels(data, edgecolor="k", facecolors='green')

# Display the plot
plt.show()
Output
It will produce the following output −

3K+ Views
