
 Data Structure
 Networking
 RDBMS
RDBMS Operating System
 Java
Java MS Excel
 iOS
iOS HTML
HTML CSS
CSS Android
 Python
 C Programming
 C++
C++ C#
C# MongoDB
 MySQL
MySQL Javascript
 PHP
PHP
- Selected Reading
- UPSC IAS Exams Notes
- Developer's Best Practices
- Questions and Answers
- Effective Resume Writing
- HR Interview Questions
- Computer Glossary
- Who is Who
How to create charts in excel using Python with openpyxl?
In this post, I will show you how to create charts in excel using Python - Openpyxl module. We will create an excel spreadsheet from scratch with Tennis players grandslam titles as the data for creating bar charts using the openpyxl module.
Introduction..
Microsoft office has started providing a new extension to Microsoft Excel sheets, which is .xlsx, from Office 2007 to support storing more rows and columns.This change had moved Excel sheets to a XML based file format with ZIP compression. The world is ruled by Microsoft spreadsheets, people have been using spreadsheets for various purposes and one of the use case is for data visualization.
Getting ready..
Python's xlrd module an alternative for Openpyxl module has been good at supporting Excel formats, however this module can be perform read only operations on excel spreadsheet. The openpyxl module can perform both read and write operations on Excel sheets.
How to do it..
1). Let us first install the openpyxl module using
pip install openpyxl.
2). Define the data for creating a new excel spreadsheet.
# import the module
import openpyxl

# Define your file name and data
file_name = "charts.xlsx"
file_data = (['player', 'titles'], ['Federer', 20], ['Nadal', 20], ['Djokovic', 17], ['Murray', 3])
3). Create a new Excel file. This creates a default sheet, called Sheet
xlsxfile = openpyxl.Workbook()
print(f" *** The sheets inside the excel_file are = {xlsxfile.sheetnames}")
new_workbook = xlsxfile['Sheet']
*** The sheets inside the excel_file are = ['Sheet']
4). Add the data about the tennis players and their grandslam titles to this sheet.
for row, (player,titles) in enumerate(file_data, 1):
new_workbook['A{}'.format(row)].value = player
new_workbook['B{}'.format(row)].value = titles
5). Finally save the data to file_name file
xlsxfile.save(file_name)
6). Load the file into memory and list all the sheets. Note we have created only one sheet as part of step 2.
import openpyxl
excel_file_data = openpyxl.load_workbook(file_name)
excel_file_data.sheetnames
['Sheet']
7). Get the first sheet and obtain the values of the cells, for e.g A2 and B2.
sheet_values = excel_file_data['Sheet']
print(f" *** One of the value from the sheet is - {sheet_values['A2'].value} - {sheet_values['B2'].value}")
*** One of the value from the sheet is - Federer - 20
8). Output all the rows and columns in our spreadsheet, just to make sure we have our data inserted properly for the charts.
for row in sheet_values:
for cell in row:
print(cell.value)
player
titles
Federer
20
Nadal
20
Djokovic
17
Murray
3
9). Import the module BarChart, Reference from openpyxl.chart and create Barchart object.
from openpyxl.chart import BarChart, Reference
chart = BarChart()
#10.
# Fill the basic information like chart title,..

chart.title = "Players & Grand Slams"
chart.y_axis.title = 'Titles'
chart.x_axis.title = 'Tennis Players'
#11.
# Now we will create a reference to the data and append the data to the chart.

data = Reference(sheet_values, min_row=2, max_row=5, min_col=1, max_col=2)
chart.add_data(data, from_rows=True, titles_from_data=True)
#12.
# Finally, Add the chart to the sheet and save the file.

new_workbook.add_chart(chart, "A6")
xlsxfile.save(file_name)
Step 11 creates a reference box through a Reference object, from row 2 column 1 to row 5 column 2, which is the area where our data lives, offcourse header is excluded.
The data is added to the chart with the .add_data() method. from_rows - makes each row a different data series. titles_from_data - uses the first column to name the series.
Example
We will put everything explained above together.
"""
Program: Create charts in excel using Python with openpyxl params: NA
output: Creates a chart.xlsx file with tennis players grandslam titles and a barchart representation of the data
"""
# import the module
import openpyxl
# Define your file name and data
file_name = "charts.xlsx"
file_data = ([ 'player' , 'titles' ], [ 'Federer' , 20 ], [ 'Nadal' , 20 ], [ 'Djokovic' , 17 ], [ 'Murray' , 3 ])
# create an excel spreadsheet
xlsxfile = openpyxl . Workbook ()
print ( f " *** The sheets inside the excel_file are = { xlsxfile . sheetnames } " )
new_workbook = xlsxfile [ 'Sheet' ]
for row , ( player , titles ) in enumerate ( file_data , 1 ):
new_workbook [ 'A {} ' . format ( row )] . value = player
new_workbook [ 'B {} ' . format ( row )] . value = titles
# save the spreadsheet
xlsxfile .save ( file_name )
# read the data
 excel_file_data = openpyxl . load_workbook ( file_name )
excel_file_data . sheetnames

sheet_values = excel_file_data [ 'Sheet' ]
print ( f " *** One of the value from the sheet is - { sheet_values [ 'A2' ] . value } - { sheet_values [ 'B2' ] . value } " )
for row in sheet_values :
for cell in row :
print ( cell . value ) # barchart creation from openpyxl.chart
import BarChart , Reference chart = BarChart ()
# Fill the basic information like chart title,..
chart . title = "Players & Grand Slams"
 chart . y_axis . title = 'Titles'
chart . x_axis . title = 'Tennis Players'
# Now we will create a reference to the data and append the data to the chart.
data = Reference ( sheet_values , min_row = 2 , max_row = 5 , min_col = 1 , max_col = 2 )
chart .
 add_data ( data , from_rows = True , titles_from_data = True )
# Finally, Add the chart to the sheet and save the file.
new_workbook . add_chart ( chart , "A6" )
 xlsxfile . save ( file_name )
*** The sheets inside the excel_file are = ['Sheet']
*** One of the value from the sheet is - Federer - 20
player
titles
Federer
20
Nadal
20
Djokovic
17
Murray
3
Output
When the above program is execute, charts.xlsx will be created in the same directory as of this code with below.
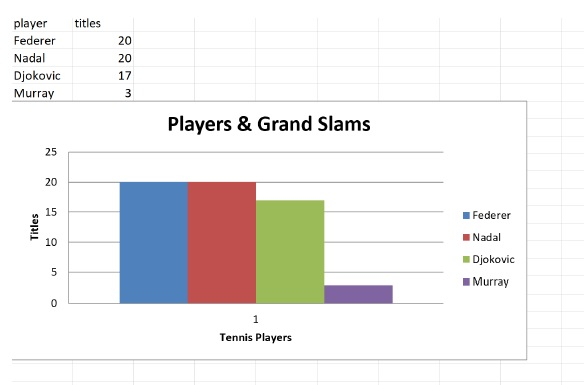

2K+ Views
