 Data Structure
 Networking
 RDBMS
RDBMS Operating System
 Java
Java MS Excel
 iOS
iOS HTML
HTML CSS
CSS Android
 Python
 C Programming
 C++
C++ C#
C# MongoDB
 MySQL
MySQL Javascript
 PHP
PHP
- Selected Reading
- UPSC IAS Exams Notes
- Developer's Best Practices
- Questions and Answers
- Effective Resume Writing
- HR Interview Questions
- Computer Glossary
- Who is Who
Python Plotly: How to define the structure of a Sankey diagram using a Pandas dataframe?
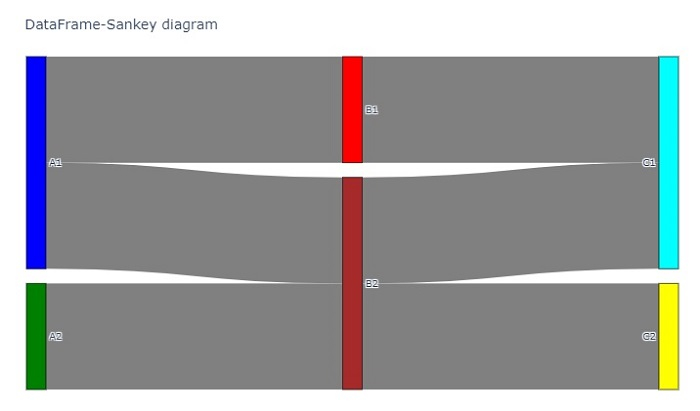
Sankey diagram is used to visualize a flow by defining a "source" to represent the source node and a "target" for the target node. It is used to represent the flow of objects between different data points.
In this tutorial, let's understand how to define the structure of Sankey diagram using a dataframe. Here we will use the plotly.graph_objects module to generate the figures. It contains a lot of methods to generate charts.
Step 1
Import the plotly.graphs_objs module and alias as go.
import plotly.graphs_objs as go
Step 2
Import the Pandas module and alias as pd.
import pandas as pd
Step 3
Create a two-dimensional list of nodes with "id", "label" and "color" coordinates ?
nodes = [
   ['id', 'label', 'color'],
   [ 0,    'A1',    'blue'],
   [ 1,    'A2',    'green'],
   [ 2,    'B1',    'red'],
   [ 3,    'B2',    'brown'],
   [ 4,    'C1',    'cyan'],
   [ 5,    'C2',    'yellow']
]
Step 4
Create a two-dimensional list of links for "source", "target", "value" and "link color", as defined below ?
links = [
   ['Source', 'Target', 'Value', 'Link Color'],
   [  0,          2,       4,       'grey'],
   [  0,          3,       4,       'grey'],
   [  1,          3,       4,       'grey'],
   [  2,          4,       4,       'grey'],
   [  3,          4,       4,       'grey'],
   [  3,          5,       4,       'grey']
]
Step 5
Calculate the node and link headers and generate two dataframes for nodes and links.
nodes_headers = nodes.pop(0)
links_headers = links.pop(0)

df_nodes = pd.DataFrame(nodes, columns = nodes_headers)
df_links = pd.DataFrame(links, columns = links_headers)
Step 6
Next, create the Sankey diagram. Add the dataframe nodes to the Sankey diagram and set its color and thickness values.
fig = go.Figure(data=[go.Sankey(
   node = dict(
      pad = 15,
      thickness = 20,
      line = dict(color = "black", width = 0.5),
      label = df_nodes['label'].dropna(axis=0, how='any'),
      color = df_nodes['color']),
Step 7
Generate the links for "source", "target", "value" and "link colors", as shown below ?
link = dict(
   source = df_links['Source'].dropna(axis=0, how='any'),
   target = df_links['Target'].dropna(axis=0, how='any'),
   value = df_links['Value'].dropna(axis=0, how='any'),
   color = df_links['Link Color'].dropna(axis=0, how='any'),
)
Step 8
Use the update_layout() method to set the title of Sankey diagram. And finally, show the chart using fig.show().
fig.update_layout(
   title_text="DataFrame-Sankey diagram",
   font_size=10
)
fig.show()
Example
The complete code to define the structure of a Sankey diagram using a Pandas dataframe is as follows ?
import plotly.graph_objects as go
import pandas as pd
nodes = [
   ['id', 'label', 'color'],
   [0, 'A1', 'blue'],
   [1, 'A2', 'green'],
   [2, 'B1', 'red'],
   [3, 'B2', 'brown'],
   [4, 'C1', 'cyan'],
   [5, 'C2', 'yellow']
]
links = [
   ['Source', 'Target', 'Value', 'Link Color'],
   [0, 2, 4, 'grey'],
   [0, 3, 4, 'grey'],
   [1, 3, 4, 'grey'],
   [2, 4, 4, 'grey'],
   [3, 4, 4, 'grey'],
   [3, 5, 4, 'grey']
]

# Retrieve headers and build dataframes
nodes_headers = nodes.pop(0)
links_headers = links.pop(0)

df_nodes = pd.DataFrame(nodes, columns=nodes_headers)
df_links = pd.DataFrame(links, columns=links_headers)

fig = go.Figure(data=[go.Sankey(
   node = dict(
      pad = 15,
      thickness = 20,
      line = dict(color = "black", width = 0.5),
      label = df_nodes['label'].dropna(axis=0, how='any'),
      color = df_nodes['color']
   ),

   link = dict(
      source=df_links['Source'].dropna(axis=0, how='any'),
      target=df_links['Target'].dropna(axis=0, how='any'),
      value=df_links['Value'].dropna(axis=0, how='any'),
      color=df_links['Link Color'].dropna(axis=0, how='any'),
   )
)])

fig.update_layout(
   title_text="DataFrame-Sankey diagram",
   font_size=10
)

fig.show()
Output
On execution, it will show the following output on the browser ?


