 Data Structure
 Networking
 RDBMS
RDBMS Operating System
 Java
Java MS Excel
 iOS
iOS HTML
HTML CSS
CSS Android
 Python
 C Programming
 C++
C++ C#
C# MongoDB
 MySQL
MySQL Javascript
 PHP
PHP
- Selected Reading
- UPSC IAS Exams Notes
- Developer's Best Practices
- Questions and Answers
- Effective Resume Writing
- HR Interview Questions
- Computer Glossary
- Who is Who
Python - Create Test DataSets using Sklearn
The Sklearn python library does provide sample data sets which can be used tocreate various graph plots. The usefulness of these datasets is in creating sample graphs and charts and predicting the behavior of the graph as the values changes. Also you can work on other parameters like deciding on the colours and axes etc on this sample graphs before using the actual data set.
Using make_blobs
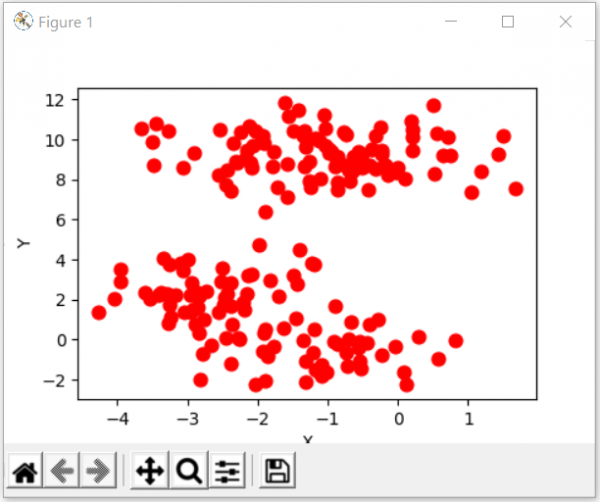
In the below example we use the sklearn library along with the matplotlib to create a scatter plot with a specific style. We choose a sample of 200 data points and also select the colour and type of the clusters.
Example
from sklearn.datasets import make_blobs
from matplotlib import pyplot as plt
from matplotlib import style
style.use("fast")
X, y = make_blobs(n_samples=200, centers=,
                  cluster_std=1, n_features=2)

plt.scatter(X[:, 0], X[:, 1], s=60, color='r')
plt.xlabel("X")
plt.ylabel("Y")
plt.show()
plt.clf()
Output
Running the above code gives us the following result −

Using make_circles
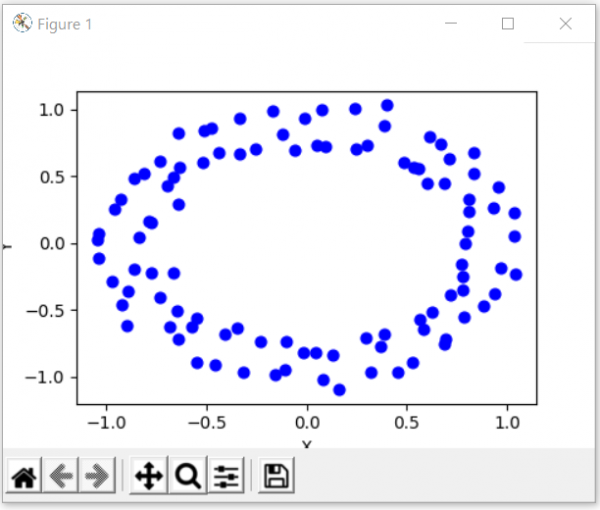
Similar to above approach we take the make_circles function to create circles with sample size of 100 and blue as the color.
Example
from sklearn.datasets import make_circles
from matplotlib import pyplot as plt
from matplotlib import style
style.use("fast")
X, y = make_circles(n_samples=100, noise=0.04)
plt.scatter(X[:, 0], X[:, 1], s=40, color='b')
plt.xlabel("X")
plt.ylabel("Y")
plt.show()
plt.clf()
Output
Running the above code gives us the following result −


