- PySimpleGUI - Home
- PySimpleGUI - Introduction
- PySimpleGUI - Environment Setup
- PySimpleGUI - Hello World
- PySimpleGUI - Popup Windows
- PySimpleGUI - Window Class
- PySimpleGUI - Element Class
- PySimpleGUI - Events
- PySimpleGUI - Menubar
- PySimpleGUI - Matplotlib Integration
- PySimpleGUI - Working with PIL
- PySimpleGUI - Debugger
- PySimpleGUI - Settings
- PySimpleGUI Useful Resources
- PySimpleGUI - Quick Guide
- PySimpleGUI - Useful Resources
- PySimpleGUI - Discussion
PySimpleGUI - Debugger
In addition to the built-in debugger that most IDEs such as PyCharm or VS Code have, PySimpleGUI offers its own debugger. This debugger provides you the ability to "see" and interact with your code, while it is running.
To use the debugger service effectively, the window should be red asynchronously, i.e., you should provide a timeout to the read() function.
The debugger window is invoked by calling show_debugger_window() function anywhere inside the program as shown below −
import PySimpleGUI as sg
sg.show_debugger_window(location=(10,10))
window = sg.Window('Debugger Demo',
   [[sg.Text('Debugger'),
   sg.Input('Input here'),
   sg.Button('Push Me')]]
)
while True:
   event, values = window.read(timeout=500)
   if event == sg.TIMEOUT_KEY:
      continue
   if event == sg.WIN_CLOSED:
      break
   print(event, values)
window.close()
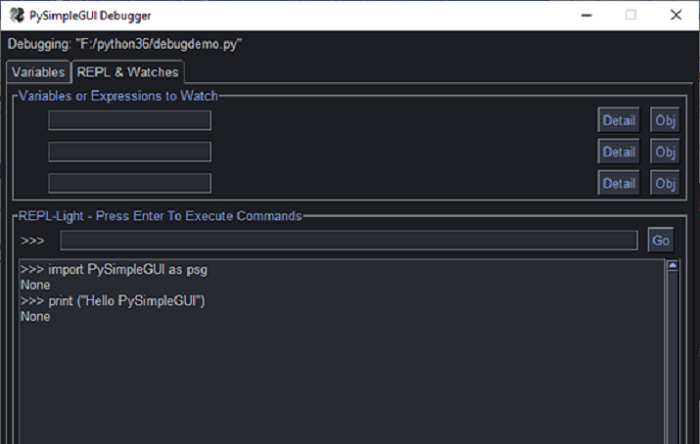
The PySimpleGUI debugger window appears at the specified screen location.
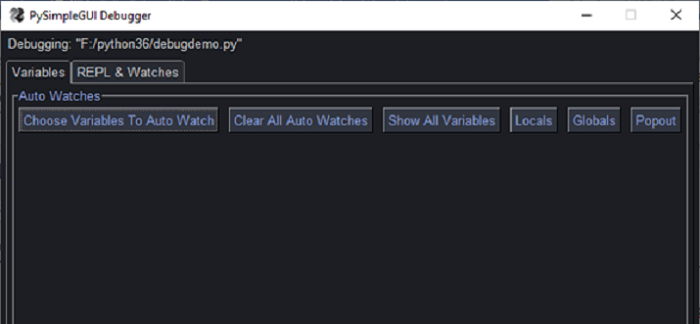
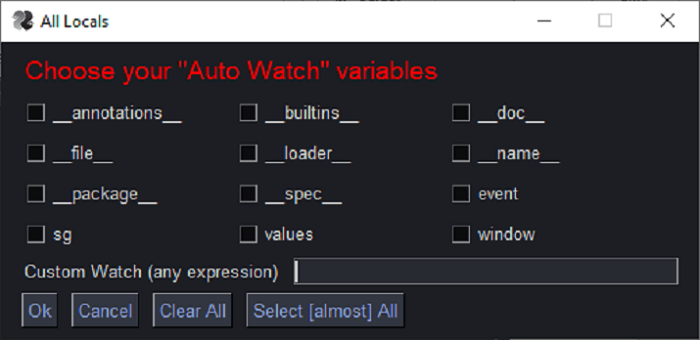
The window shows two tabs Variables and REPL. Click on the Variables tab. A list of variables to auto-watch is shown Check the ones that you want to watch during the execution of the program.
The second tab about REPL gives a Python interactive console to be executed around your programs environment so that you can inspect the values of desired variables in the code.