
Article Categories
- All Categories
-
 Data Structure
-
 Networking
-
 RDBMS
RDBMS
-
 Operating System
-
 Java
Java
-
 MS Excel
-
 iOS
iOS
-
 HTML
HTML
-
 CSS
CSS
-
 Android
-
 Python
-
 C Programming
-
 C++
C++
-
 C#
C#
-
 MongoDB
-
 MySQL
MySQL
-
 Javascript
-
 PHP
PHP
-
 Economics & Finance
Psensor graphical hardware temperature monitor for linux
Generally speaking, Linux administrators are supposed to track the performance of your computer hardware issues or faults which might occur accidentally. Sometimes, overheating issues can occur due to various software concerns such as buggy graphics card driver, mis-configured fan control program, malfunctioning CPU frequency scaling daemon, etc. If these problems are not detected early, these might become serious threats which may cause permanent damage on your hardware. Hence, keeping an eye on over heating issues should be your top priority.
Psensor is considered to be one of the simplest application to monitor hardware temperature and to plot real-time analytics from raw data for quick review.
Features of Psensor
Some of the key attributes of psensor tool are listed below –
- Shows Temperature of motherboard, CPU, GPU (Nvidia), Hard Disk Drives
- Displays CPU fan speed
- Capable of showing Remote Server Temperature and Fan Speed
- Can detect hardware devices and reports the temperature as a text format
- Ability to alert critical temperature issues using alert sound
- Easy of use and less configuration required
Dependencies
Psensor depends upon lm-sensor and hddtemp packages to get the reports about temperature and fan speed. To install these packages, use the following command –
# apt-get install lm-sensors hddtemp
The above command is required a root permission.
The sample output should be like this –
Reading package lists... Done
Building dependency tree
Reading state information... Done
Suggested packages:
ksensors fancontrol sensord read-edid i2c-tools
The following NEW packages will be installed:
hddtemp lm-sensors
0 upgraded, 2 newly installed, 0 to remove and 0 not upgraded.
Need to get 137 kB of archives.
After this operation, 673 kB of additional disk space will be used.
Get:1 <a href="https://in.archive.ubuntu.com/ubuntu/" rel="nofollow noopener noreferrer" target="_blank">https://in.archive.ubuntu.com/ubuntu/</a> trusty/universe hddtemp amd64 0.3-beta15-52 [52.8 kB]
...
Installing Psensor
To install Psensor from Linux command line tool, use the following command –
# apt-get install psensor
The sample output should be like this –
Reading package lists... Done
Building dependency tree
Reading state information... Done
The following extra packages will be installed:
psensor-common
The following NEW packages will be installed:
psensor psensor-common
0 upgraded, 2 newly installed, 0 to remove and 0 not upgraded.
Need to get 89.5 kB of archives.
After this operation, 715 kB of additional disk space will be used.
Do you want to continue? [Y/n]
Get:1 <a href="https://in.archive.ubuntu.com/ubuntu/" rel="nofollow noopener noreferrer" target="_blank">http://in.archive.ubuntu.com/ubuntu/</a> trusty/universe psensor-common all 0.8.0.3-1ubuntu3 [36.7 kB]
Get:2 <a href="http://in.archive.ubuntu.com/ubuntu/" rel="nofollow noopener noreferrer" target="_blank">https://in.archive.ubuntu.com/ubuntu/</a> trusty/universe psensor amd64 0.8.0.3-1ubuntu3 [52.8 kB]
....
Download the most recent stable Psensor (i.e version 1.1.3) source and compile it using the following command-
# wget http://wpitchoune.net/psensor/files/psensor-1.1.3.tar.gz # tar zxvf psensor-1.1.3.tar.gz
# cd psensor-1.1.3/
# ./configure
Testing and Usage of Psensor
To open Psensor tool from Linux command line, use the following command –
$ sensors
The sample output should be like this –
acpitz-virtual-0
Adapter:    Virtual device
temp1:     +46.5°C (crit = +99.0°C)
dell_smm-virtual-0
Adapter:        Virtual device
Processor Fan:  0 RPM
CPU:           +46.0°C
Ambient:       +49.0°C
Other:         +44.0°C
GPU:           +16.0°C
coretemp-isa-0000
Adapter: ISA adapter
Physical id 0:   +46.0°C (high = +100.0°C, crit = +100.0°C)
Core 0:          +46.0°C (high = +100.0°C, crit = +100.0°C)
Core 1:          +45.0°C (high = +100.0°C, crit = +100.0°C)
From the above, we will be able to see the result clearly along with temperature of CPU and Processor fan.
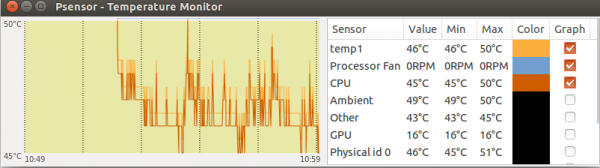
To Run Psensor tool from the Desktop Application Menu for getting a graphical viewpoint, The output should be like this –
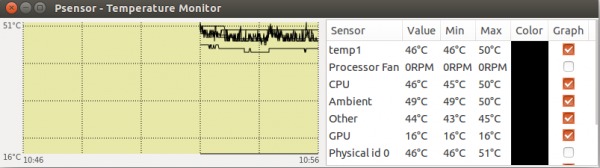
Check mark all the sensors to plot the graph. You may notice the color codes as shown below –
To Customize Psensor
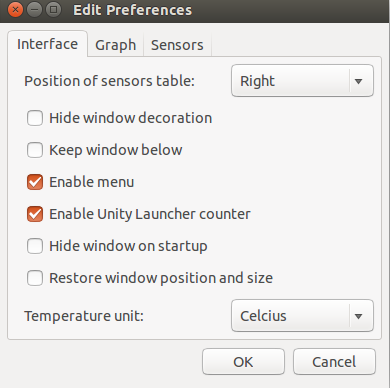
Go to Menu Psensor → Preferences → Interface
Select the preference based on your requirement. The below is a sample screen shot of the Edit preference window –
Congratulations! Now, you know “How to monitor the Hardware Temperature in Linux ”. We’ll learn more about these types of commands in our next Linux post. Keep reading!

674 Views
