 Data Structure
 Networking
 RDBMS
RDBMS Operating System
 Java
Java MS Excel
 iOS
iOS HTML
HTML CSS
CSS Android
 Python
 C Programming
 C++
C++ C#
C# MongoDB
 MySQL
MySQL Javascript
 PHP
PHP
- Selected Reading
- UPSC IAS Exams Notes
- Developer's Best Practices
- Questions and Answers
- Effective Resume Writing
- HR Interview Questions
- Computer Glossary
- Who is Who
Plot the Size of each Group in a Groupby object in Pandas
Pandas is a powerful Python library mainly used for data analysis. Since it contains large and complicated numeric datasets that are difficult to understand, we need to plot these datasets which makes it easy to visualize relationships within the given dataset. Python provides several libraries such as Matplotlib, Plotly and Seaborn to create informative plots from the given data with ease. In this article, we will show how to plot the size of each group in a Groupby object in Pandas.
Python Program to Plot the Size of each Group in a Groupby Object
To plot the size of each group, we will use the below mentioned Libraries of Python:
Matplotlib
Seaborn
Plotly
Let's discuss their practical implementation in plotting size of each group of Pandas DataFrame with the help of example programs.
Using Matplotlib
It is the oldest and most widely used Python library for plotting. It provides a low-level interface that gives us full control over every aspect of our graphs, such as axes, labels, legends, colors, markers, and so forth. We can also integrate it with other libraries such as NumPy and Pandas to plot data from various sources.
Example 1
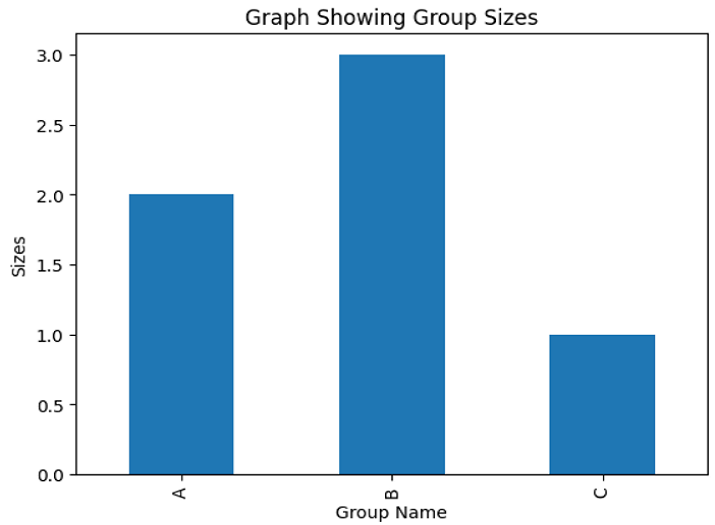
The following example illustrates the use of matplotlib with groupby object to plot the size of a specified group.
Approach
Import the pandas library with reference name 'pd' and the pyplot module from the matplotlib library and renames it to plt.
Create a dictionary data containing two columns 'Group_name' and 'Values'.
Pass this dictionary to the DataFrame() method of Pandas to create a DataFrame named 'df'.
Now, use the groupby() method to group the DataFrame by the 'Group_name' column. We then call the size() method to get the size of each group. The resulting object is a groupby object will get stored in 'group_sizes'.
Call the plot() method on the 'group_sizes' object by specifying kind = 'bar' to create a bar plot. Then, using some built-in methods set the x-axis label, y-axis label, and plot title.
Finally, we call show() method to display the plot.
import pandas as pd
import matplotlib.pyplot as plt
# Creating a user-defined DataFrame
data = {'Group_name': ['A', 'A', 'B', 'B', 'B', 'C'],
      'Values': [10, 12, 30, 14, 50, 16] }
df = pd.DataFrame(data)
# using groupby() method and getting the size
group_sizes = df.groupby('Group_name').size()
# to plot the size of group using Matplotlib
group_sizes.plot(kind='bar')
plt.xlabel('Group Name')
plt.ylabel('Sizes')
plt.title('Graph Showing Group Sizes')
plt.show()
Output

Using Seaborn
It is built on top of pyplot module in Matplotlib that offers a higher-level interface for data visualization with better color palettes and grid layouts.
Example 2
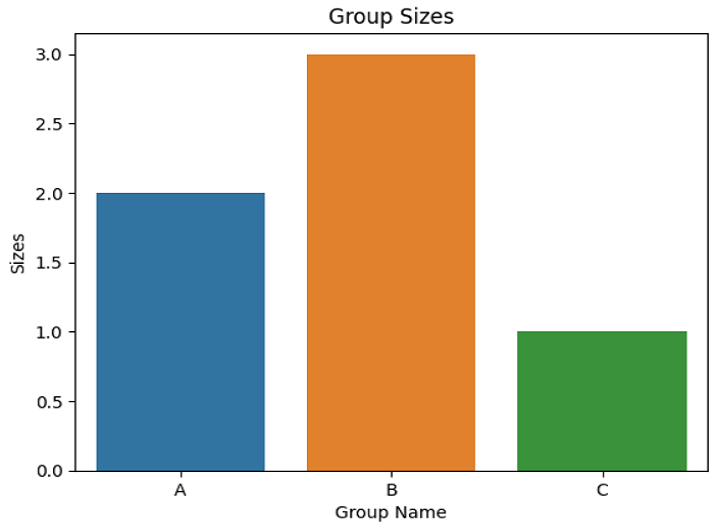
In the following example, we will use the seaborn with groupby object to plot the size of a specified group.
Approach
Import pandas and seaborn library with reference name pd and sns respectively.
Similar to the previous code, create a dictionary data containing two columns 'Group_name' and 'Values'.
Then, pass this dictionary to the DataFrame() method of Pandas to create a DataFrame named 'df'.
Using the groupby() method, we group the DataFrame by the 'Group_name' column. Then, call the size() method on this object to get the size of each group. Here, we will use an additional method named 'reset_index()' to convert the result into a DataFrame with columns 'Group_name' and 'Size'. The resulting object is a groupby object will get stored in 'group_sizes'.
Now, use the built-in method barplot() of Seaborn to create a bar plot. We pass the group_sizes DataFrame as the data parameter. We specify the x-axis column name as 'Group_name' and the y-axis column name as 'Sizes'.
Then, using some built-in methods set the x-axis label, y-axis label, and plot title.
Finally, we call show() method to display the plot.
import pandas as pd
import seaborn as sns
# Creating a user-defined DataFrame
data = {'Group_name': ['A', 'A', 'B', 'B', 'B', 'C'],
        'Values': [1, 2, 3, 4, 5, 6] }
df = pd.DataFrame(data)
# using groupby() method and getting the size
group_sizes = df.groupby('Group_name').size().reset_index(name='Size')
# to plot the size of group using Seaborn
sns.barplot(data=group_sizes, x='Group_name', y='Size')
plt.xlabel('Group Name')
plt.ylabel('Sizes')
plt.title('Group Sizes')
plt.show() # to show the result
Output

Using Plotly
The advantage of using Plotly over the previous two libraries is its interactive nature, allowing us to zoom, pan, and explore the plot in more detail.
Example 3
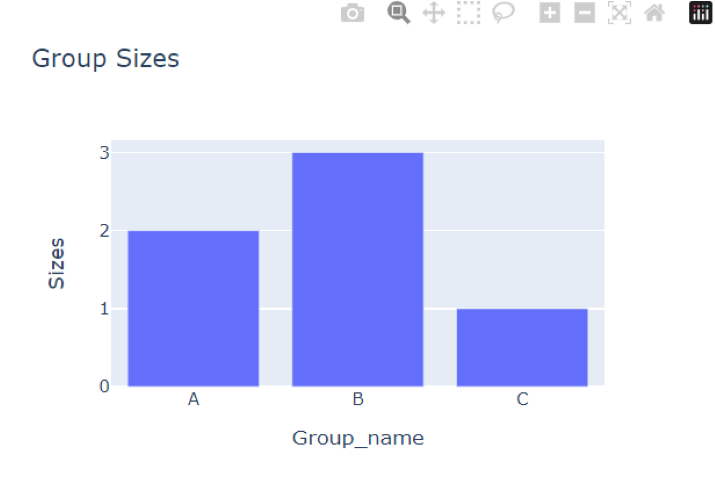
In this example, we will modify the code from the previous example to plot the size of specified group using plotly and groupby().
import pandas as pd
import plotly.express as px
# Creating a user-defined DataFrame
data = {'Group_name': ['A', 'A', 'B', 'B', 'B', 'C'],
        'Values': [1, 2, 3, 4, 5, 6]}
df = pd.DataFrame(data)
# using groupby() method and getting the size
group_sizes = df.groupby('Group_name').size().reset_index(name = 'Sizes')
# to plot the size of group using Plotly
fig = px.bar(group_sizes, x = 'Group_name', y = 'Sizes', title = 'Group Sizes', width = 500, height = 350)
fig.show() # to show the result
Output

In the above code, we have used the 'bar()' method from Plotly Express to create a bar plot. We passed the group_sizes DataFrame as the first argument. We specify the x-axis column name as 'Group_name', the y-axis column name as 'Sizes' and the plot title as 'Group Sizes'. Instead of plt.show(), we called fig.show() to display the plot.
Conclusion
In this article, we have discussed three approaches to plot the size of each group in a groupby object of Pandas DataFrame. These three approaches are matplotlib, seaborn and plotly. They are the most popular and widely used libraries used for plotting.

