
Article Categories
- All Categories
-
 Data Structure
-
 Networking
-
 RDBMS
RDBMS
-
 Operating System
-
 Java
Java
-
 MS Excel
-
 iOS
iOS
-
 HTML
HTML
-
 CSS
CSS
-
 Android
-
 Python
-
 C Programming
-
 C++
C++
-
 C#
C#
-
 MongoDB
-
 MySQL
MySQL
-
 Javascript
-
 PHP
PHP
-
 Economics & Finance
Selected Reading
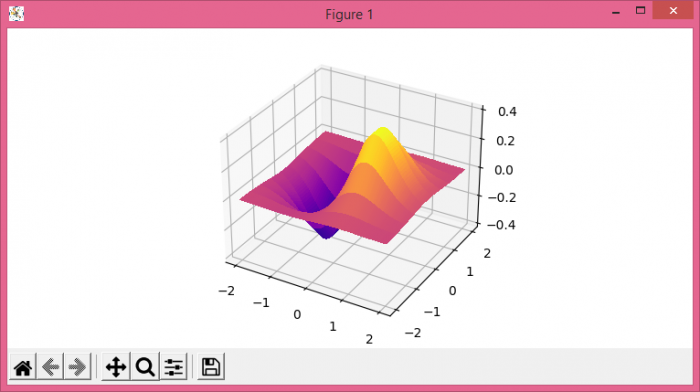
Plot a 3D surface from {x,y,z}-scatter data in Python Matplotlib
To plot a 3D surface from x, y and z scatter data in Python, we can use matplotlib's plot_surface() method. This creates stunning 3D visualizations from coordinate data.
Basic 3D Surface Plot
Here's how to create a 3D surface plot using mathematical function data ?
import matplotlib.pyplot as plt
import numpy as np

# Set figure size
plt.rcParams["figure.figsize"] = [7.50, 3.50]
plt.rcParams["figure.autolayout"] = True

# Create figure and 3D axes
fig = plt.figure()
ax = fig.add_subplot(111, projection='3d')

# Generate coordinate data
x = np.linspace(-2, 2, 100)
y = np.linspace(-2, 2, 10)
X, Y = np.meshgrid(x, y)
Z = X * np.exp(-X ** 2 - Y ** 2)

# Plot the 3D surface
ax.plot_surface(X, Y, Z, rstride=1, cstride=1, cmap="plasma",
                linewidth=0, antialiased=False)

plt.show()
Creating Surface from Scatter Points
When you have discrete scatter points, you need to interpolate them into a grid first ?
import matplotlib.pyplot as plt
import numpy as np
from scipy.interpolate import griddata

# Sample scatter data points
x_scatter = np.random.uniform(-2, 2, 50)
y_scatter = np.random.uniform(-2, 2, 50)
z_scatter = x_scatter * np.exp(-x_scatter**2 - y_scatter**2)

# Create regular grid for surface
xi = np.linspace(-2, 2, 30)
yi = np.linspace(-2, 2, 30)
X, Y = np.meshgrid(xi, yi)

# Interpolate scattered data onto regular grid
Z = griddata((x_scatter, y_scatter), z_scatter, (X, Y), method='cubic')

# Plot the interpolated surface
fig = plt.figure(figsize=(8, 6))
ax = fig.add_subplot(111, projection='3d')
ax.plot_surface(X, Y, Z, cmap='viridis', alpha=0.8)

# Plot original scatter points
ax.scatter(x_scatter, y_scatter, z_scatter, color='red', s=20)

plt.show()
Key Parameters
| Parameter | Description | Example Values |
|---|---|---|
cmap |
Color scheme | 'viridis', 'plasma', 'coolwarm' |
rstride |
Row sampling step | 1, 2, 5 |
cstride |
Column sampling step | 1, 2, 5 |
alpha |
Transparency level | 0.0 to 1.0 |
Adding Labels and Title
import matplotlib.pyplot as plt
import numpy as np

fig = plt.figure(figsize=(8, 6))
ax = fig.add_subplot(111, projection='3d')

# Generate surface data
x = np.linspace(-2, 2, 50)
y = np.linspace(-2, 2, 50)
X, Y = np.meshgrid(x, y)
Z = np.sin(np.sqrt(X**2 + Y**2))

# Create surface plot with customization
surface = ax.plot_surface(X, Y, Z, cmap='coolwarm',
                         linewidth=0, antialiased=True)

# Add labels and title
ax.set_xlabel('X Axis')
ax.set_ylabel('Y Axis')
ax.set_zlabel('Z Axis')
ax.set_title('3D Surface Plot')

# Add color bar
fig.colorbar(surface, shrink=0.5, aspect=5)

plt.show()
Output
The code generates a 3D surface plot with the specified colormap and styling. The surface represents the mathematical function across the X-Y plane with Z values determining the height.
Conclusion
Use plot_surface() with meshgrid data for smooth 3D surfaces. For scatter data, interpolate using griddata() first, then plot the resulting surface.

Updated on: 2026-03-25T22:10:20+05:30
5K+ Views

Advertisements