 Data Structure
 Networking
 RDBMS
RDBMS Operating System
 Java
Java MS Excel
 iOS
iOS HTML
HTML CSS
CSS Android
 Python
 C Programming
 C++
C++ C#
C# MongoDB
 MySQL
MySQL Javascript
 PHP
PHP
- Selected Reading
- UPSC IAS Exams Notes
- Developer's Best Practices
- Questions and Answers
- Effective Resume Writing
- HR Interview Questions
- Computer Glossary
- Who is Who
OpenCV Python – How to find and draw extreme points of an object on an image?
To find and draw the extreme points of an object in the input image, we could follow the steps given below ?
The first step is to import required libraries. In all below Python examples the required Python library is OpenCV. Make sure you have already installed it.
The next step is to read an input image using the cv2.imread() function. Specify the full image path with image types (.jpg or .png). Convert the input image to grayscale.
Apply thresholding on the grayscale image to create a binary image. Adjust the second parameter to get a better contour detection.
ret,thresh = cv2.threshold(gray,150,255,0)
Find the contours in the image using cv2.findContours() function.
contours, _ = cv2.findContours(thresh, cv2.RETR_TREE, cv2.CHAIN_APPROX_SIMPLE)
Select a contour (say first contour) cnt from the lists of contours. Or Loop over all the contours.
Find the extreme points leftmost, rightmost, topmost, and bottommost.
leftmost = tuple(cnt[cnt[:,:,0].argmin()][0])
rightmost = tuple(cnt[cnt[:,:,0].argmax()][0])
topmost = tuple(cnt[cnt[:,:,1].argmin()][0])
bottommost = tuple(cnt[cnt[:,:,1].argmax()][0])
Draw these extreme points on the image. To draw a point on the image we draw a filled circle with a small radius.
Display the image with drawn contours and approximate contours on it.
Let's understand how to find and draw extreme points of an object in an image with the help of some Python examples.
Example
The Python 3 program below shows how to find and draw extreme points of an object in the image.
# import required libraries
import cv2

# load the input image
img = cv2.imread('four-point-star.png')

# convert the input image to grayscale
gray = cv2.cvtColor(img, cv2.COLOR_BGR2GRAY)

# apply thresholding to convert grayscale to binary image
ret,thresh = cv2.threshold(gray,150,255,0)

# find the contours
contours,hierarchy = cv2.findContours(thresh,
cv2.RETR_TREE,cv2.CHAIN_APPROX_SIMPLE)
print("Number of contours detected:", len(contours))

# select the first contour
cnt = contours[0]

# find the extreme points
leftmost = tuple(cnt[cnt[:,:,0].argmin()][0])
rightmost = tuple(cnt[cnt[:,:,0].argmax()][0])
topmost = tuple(cnt[cnt[:,:,1].argmin()][0])
bottommost = tuple(cnt[cnt[:,:,1].argmax()][0])
points = [leftmost, rightmost, topmost, bottommost]

# draw the points on th image
for point in points:
   cv2.circle(img, point, 4, (0, 0, 255), -1)

# display the image with drawn extreme points
while True:
   cv2.imshow("Extreme Points", img)
   if cv2.waitKey(1) & 0xFF == 27:
      break
cv2.destroyAllWindows()
We will use the following image as the Input File for this program ?

Output
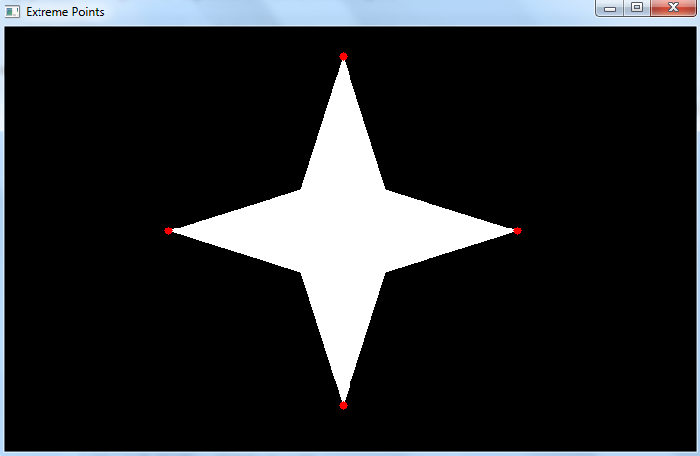
When we execute the above code, it will produce the following output ?
Number of contours detected: 1
And we get the following window showing the output ?

Notice the four extreme points leftmost, rightmost, topmost and bottommost are drawn in red color.
Example
In this Python program, we draw extreme points of the objects in an input image.
# import required libraries
import cv2

# load the input image
img = cv2.imread('two-shapes.png')

# convert the input image to grayscale
gray = cv2.cvtColor(img, cv2.COLOR_BGR2GRAY)

# apply thresholding to convert grayscale to binary image
ret,thresh = cv2.threshold(gray,150,255,0)

# find the contours
contours,hierarchy = cv2.findContours(thresh,
cv2.RETR_TREE,cv2.CHAIN_APPROX_SIMPLE)
print("Number of contours detected:", len(contours))

# loop over all the contours
for cnt in contours:
   # extreme points
   leftmost = tuple(cnt[cnt[:,:,0].argmin()][0])
   rightmost = tuple(cnt[cnt[:,:,0].argmax()][0])
   topmost = tuple(cnt[cnt[:,:,1].argmin()][0])
   bottommost = tuple(cnt[cnt[:,:,1].argmax()][0])
   points = [leftmost, rightmost, topmost, bottommost]

   # draw the points on th image
   for point in points:
      cv2.circle(img, point, 4, (0, 0, 255), -1)

# display the image with drawn extreme points
while True:
   cv2.imshow("Extreme Points", img)
   if cv2.waitKey(1) & 0xFF == 27:
      break
cv2.destroyAllWindows()
We will use the following image as the Input File for this program ?

Output
When we execute the above code, it will produce the following output ?
Number of contours detected: 2
And we get the below window showing the output-

Notice that the extreme points leftmost, rightmost, topmost and bottommost are drawn in red color. In the above output, the extreme points for two different objects (shapes) are drawn.

