- Project Management Home
- Activity Based Costing
- Agile Project Management
- Basic Management Skills
- Basic Quality Tools
- Benchmarking Process
- Cause and Effect Diagram
- Change Management Process
- Communication Blockers
- Communication Channels
- Communication Methods
- Communication Models
- Communications Management
- Conflict Management
- Crisis Management
- Critical Chain Scheduling
- Critical Path Method
- Decision Making Process
- Design of Experiment
- Effective Communication Skills
- Effective Presentation Skills
- Enterprise Resource Planning
- Event Chain Methodology
- Extreme Project Management
- Gantt Chart Tool
- Just-In-Time Manufacturing
- Knowledge Management
- Leads, Lags and Floats
- Management Best Practices
- Management Styles
- Management by Objectives
- Monte Carlo Analysis
- Motivation Theories
- Negotiation Skills
- Organizational Structures
- PERT Estimation Technique
- PRINCE2 Project Methodology
- Pareto Chart Tool
- Powerful Leadership Skills
- Process Based Management
- Procurement Documents
- Procurement Management
- Project Activity Diagram
- Project Charter
- Project Contract Types
- Project Cost Control
- Project Kick-off Meeting
- Project Lessons Learned
- Project Management Methodologies
- Project Management Office
- Project Management Processes
- Project Management Tools
- Project Management Triangle
- Project Manager Goals
- Project Portfolio Management
- Project Quality Plan
- Project Records Management
- Project Risk Categories
- Project Risk Management
- Project Scope Definition
- Project Selection Method
- Project Success Criteria
- Project Time Management
- Project Workforce Management
- Project Management Softwares
- QC and QA Processes
- RACI Chart Tool
- Recognition and Rewards
- Requirement Collection
- Resource Leveling
- Staffing Management Plan
- Stakeholder Management
- Statement of Work (SOW)
- Stress Management Techniques
- Structured Brainstorming
- Succession Planning
- Supply Chain Management
- Team Building Program
- Team Motivation
- The Balanced Scorecard
- The Halo Effect
- The Make or Buy Decision
- The Rule of Seven
- The Virtual Team
- Total Productive Maintenance
- Total Quality Management
- Traditional Project Management
- Work Breakdown Structure
Cause and Effect Diagram
Introduction
There are a number of productivity and management tools used in business organizations. Cause and Effect Diagram, in other words, Ishikawa or Fishbone diagram, is one such management tool. Due to the popularity of this tool, majority of managers make use of this tool regardless of the scale of the organization.
Problems are meant to exist in organizations. That's why there should be a strong process and supporting tools for identifying the causes of the problems before the problems damage the organization.
Steps for Using the Tool
Following are the steps that can be followed to successfully draw a cause and effect diagram:
Step 1 - Properly identify the problem in hand
Start articulating the exact problem you are facing. Sometimes, identification of the problem may not be straightforward. In such instances, write down all the effects and observations in detail. A short brainstorming session may be able to point out t the actual problem.
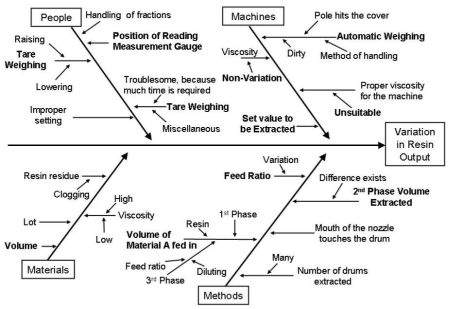
When it comes to properly identifying the problem, there are four properties to consider; who are involved, what the problem is, when it occurs, and where it occurs. Write down the problem in a box, which is located at the left hand corner (refer the example cause and effect diagram). From the box, draw a line horizontally to the right hand side. The arrangement will now look like the head and the spine of a fish.
Step 2 - Add the major factors that contribute to the problem
In this step, the main factors of the problem are identified. For each factor, draw off a line from the fish's spine and properly label it. These factors can be various things such as people, material, machinery or external influences.
Think more and add as many as factors into the cause and effect diagram.
Brainstorming becomes quite useful in this phase, as people can look at the problem in different angles and identify different contributing factors.
The factors you added now become the bones of the fish.
Step 3 - Identify the causes
Take one factor at a time when identifying possible causes. Brainstorm and try to identify all causes that apply to each factor. Add these causes horizontally off from the fish bones and label them.
If the cause is large in size or complex in nature, you can further breakdown and add them as sub causes to the main cause. These sub causes should come off from the relevant cause lines.
Spend more time in this step; the collection of causes should be comprehensive.
Step 4 - Diagram analysis
When this step starts, you have a diagram that indicates the problem, the contributing factors, and all possible causes for the problem.
Depending on the brainstorming ideas and nature of the problem, you can now prioritize the causes and look for the most likely cause.
This analysis may lead to further activities such as investigations, interviews and surveys. Refer the following sample cause and effect diagram:
Use of cause and effect diagrams
When it comes to the use of cause and effect diagrams, brainstorming is a critical step. Without proper brainstorming, a fruitful cause and effect diagram cannot be derived.
Therefore, following considerations should be addressed in the process of deriving a cause and effect diagram:
There should be a problem statement that describes the problem accurately. Everyone in the brainstorming session should agree on the problem statement.
Need to be succinct in the process.
For each node, think all the possible causes and add them into the tree.
Connect each casualty line back to its root cause.
Connect relatively empty branches to others.
If a branch is too bulky, consider splitting it in two.
Conclusion
Cause and Effect diagrams can be used to resolve organizational problems efficiently.
There are no limitations or restrictions on applying the diagrams to different problems or domains. The level and intensity of brainstorming defines the success rate of cause and effect diagrams.
Therefore, all relevant parties should be present in the brainstorming session in order to identify all possible causes.
Once most likely causes are identified, further investigation is required to unearth further details.
