 Data Structure
 Networking
 RDBMS
RDBMS Operating System
 Java
Java MS Excel
 iOS
iOS HTML
HTML CSS
CSS Android
 Python
 C Programming
 C++
C++ C#
C# MongoDB
 MySQL
MySQL Javascript
 PHP
PHP
- Selected Reading
- UPSC IAS Exams Notes
- Developer's Best Practices
- Questions and Answers
- Effective Resume Writing
- HR Interview Questions
- Computer Glossary
- Who is Who
Linear Regression using PyTorch?
About Linear Regression
Simple Linear Regression Basics
Allows us to understand relationship between two continuous variable.
-
Example −
-
x = independent variable
weight
-
y = dependent variable
height
-
y = αx + β
Let's understand simple linear regression through a program −
#Simple linear regression

import numpy as np
import matplotlib.pyplot as plt

np.random.seed(1)
n = 70
x = np.random.randn(n)
y = x * np.random.randn(n)

colors = np.random.rand(n)
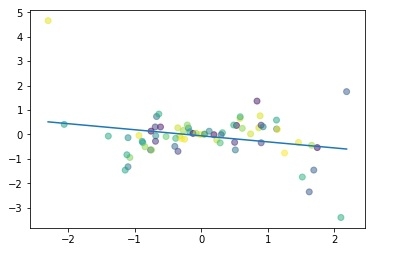
plt.plot(np.unique(x), np.poly1d(np.polyfit(x, y, 1))(np.unique(x)))

plt.scatter(x, y, c = colors, alpha = 0.5)
plt.show()
Output

Purpose of Linear Regression:
to Minimize the distance between the points and the line (y = αx + β)
-
Adjusting
Coefficient: α
Intercept/Bias: β
Building a Linear Regression Model with PyTorch
Let's suppose our coefficient (α) is 2 and intercept (β) is 1 then our equation will become −
y = 2x +1 #Linear model
Building the Dataset
x_values = [i for i in range(11)]
x_values
Output
[0, 1, 2, 3, 4, 5, 6, 7, 8, 9, 10]
#convert to numpy
x_train = np.array(x_values, dtype = np.float32)
x_train.shape
Output
(11,)
#Important: 2D required
x_train = x_train.reshape(-1, 1)
x_train.shape
Output
(11, 1)
y_values = [2*i + 1 for i in x_values]
y_values
Output
[1, 3, 5, 7, 9, 11, 13, 15, 17, 19, 21]
#list iteration

y_values = []
for i in x_values:
result = 2*i +1
y_values.append(result)

y_values
Output
[1, 3, 5, 7, 9, 11, 13, 15, 17, 19, 21]
y_train = np.array(y_values, dtype = np.float32)
y_train.shape
Output
(11,)
#2D required
y_train = y_train.reshape(-1, 1)
y_train.shape
Output
(11, 1)
Building Model
#import libraries
import torch
import torch.nn as nn
from torch.autograd import Variable

#Create Model class
class LinearRegModel(nn.Module):
def __init__(self, input_size, output_size):
super(LinearRegModel, self).__init__()
self.linear = nn.Linear(input_dim, output_dim)

def forward(self, x):
out = self.linear(x)
return out

input_dim = 1
output_dim = 1

model = LinearRegModel(input_dim, output_dim)

criterion = nn.MSELoss()

learning_rate = 0.01
optimizer = torch.optim.SGD(model.parameters(), lr = learning_rate)

epochs = 100
for epoch in range(epochs):
epoch += 1
#convert numpy array to torch variable
inputs = Variable(torch.from_numpy(x_train))
labels = Variable(torch.from_numpy(y_train))

#Clear gradients w.r.t parameters
optimizer.zero_grad()

#Forward to get output
outputs = model.forward(inputs)

#Calculate Loss
loss = criterion(outputs, labels)

#Getting gradients w.r.t parameters
loss.backward()

#Updating parameters
optimizer.step()

print('epoch {}, loss {}'.format(epoch, loss.data[0]))
Output
epoch 1, loss 276.7417907714844
epoch 2, loss 22.601360321044922
epoch 3, loss 1.8716105222702026
epoch 4, loss 0.18043726682662964
epoch 5, loss 0.04218350350856781
epoch 6, loss 0.03060017339885235
epoch 7, loss 0.02935197949409485
epoch 8, loss 0.02895027957856655
epoch 9, loss 0.028620922937989235
epoch 10, loss 0.02830091118812561
......
......
epoch 94, loss 0.011018744669854641
epoch 95, loss 0.010895680636167526
epoch 96, loss 0.010774039663374424
epoch 97, loss 0.010653747245669365
epoch 98, loss 0.010534750297665596
epoch 99, loss 0.010417098179459572
epoch 100, loss 0.010300817899405956
So we can the loss is reduced considerably from epoch 1 to epoch 100.
Plot the graph
#Purely inference
predicted = model(Variable(torch.from_numpy(x_train))).data.numpy()
predicted
y_train

#Plot Graph

#Clear figure
plt.clf()

#Get predictions
predicted = model(Variable(torch.from_numpy(x_train))).data.numpy()

#Plot true data
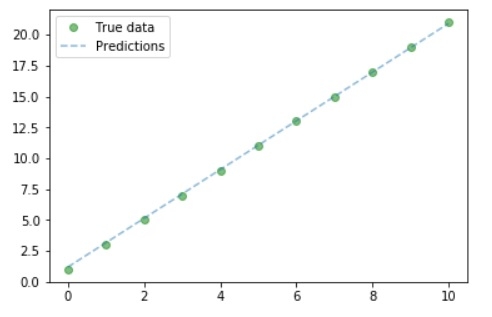
plt.plot(x_train, y_train, 'go', label ='True data', alpha = 0.5)

#Plot predictions
plt.plot(x_train, predicted, '--', label='Predictions', alpha = 0.5)

#Legend and Plot
plt.legend(loc = 'best')
plt.show()
Output

So we can from the graph- our true and predicted value almost similar.

Advertisements
