- iOS - Home
- iOS - Getting Started
- iOS - Environment Setup
- iOS - Objective-C Basics
- iOS - First iPhone Application
- iOS - Actions and Outlets
- iOS - Delegates
- iOS - UI Elements
- iOS - Accelerometer
- iOS - Universal Applications
- iOS - Camera Management
- iOS - Location Handling
- iOS - SQLite Database
- iOS - Sending Email
- iOS - Audio & Video
- iOS - File Handling
- iOS - Accessing Maps
- iOS - In-App Purchase
- iOS - iAd Integration
- iOS - GameKit
- iOS - Storyboards
- iOS - Auto Layouts
- iOS - Twitter & Facebook
- iOS - Memory Management
- iOS - Application Debugging
iOS - Application Debugging
We may commit mistakes while developing an application, which can lead to different kinds of errors. In order to fix these errors or bugs, we need to debug the application.
Selecting a Debugger
Xcode has two debuggers namely, GDB and LLDB debuggers. GDB is selected by default. LLDB is a debugger that is a part of the LLVM open-source compiler project. You can change the debugger by "edit active schemes" option.
How to Find Coding Errors?
To locate coding-related errors, you need to build your application which will compile the code. In case the code contains errors, the compiler will display all the messages, errors, and warnings with their possible reasons.
You can click Product and then Analyze to locate possible issues in an application.
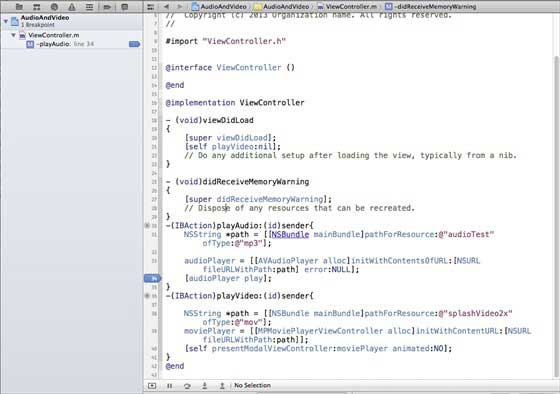
Set Breakpoints
Breakpoints help us to know the different states of our application objects, which help us identifying many flaws including logical issues. We just need to click over the line number to create a breakpoint. To remove a breakpoint, simply click and drag it out. The following screenshot shows how to set a breakpoint −
When we run the application and select the playVideo button, the application will pause at the line number where we had set the breakpoint. It allows us the time to analyze the state of the application. When the breakpoint is triggered, we will get an output as shown below.
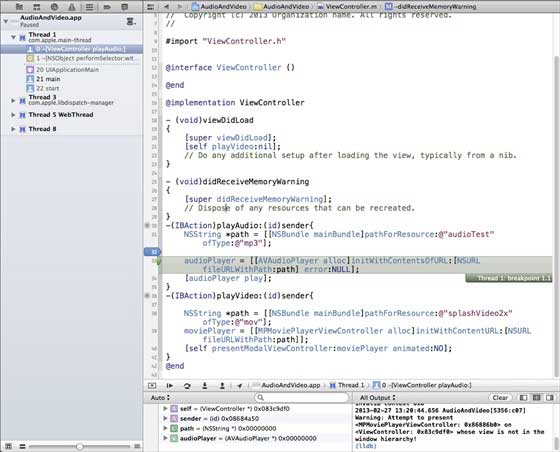
You can easily identify which thread has triggered the breakpoint. In the bottom, you can see objects like self, sender and so on, which hold the values of the corresponding objects and we can expand some of these objects, and see what is the state of each of these objects.
To continue the application we will select the continue button (left most button), in the debug area shown below. The other options include step in, step out and step over.

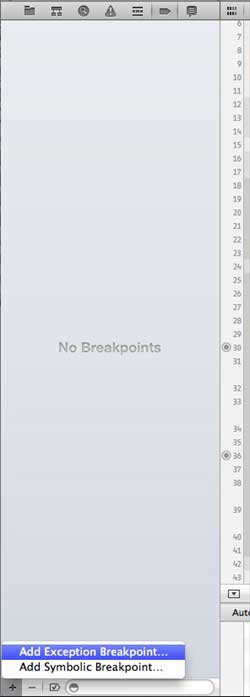
Exception Breakpoint
We also have exception breakpoints that trigger an application to stop at the location where the exception occurs. We can insert exception breakpoints by selecting the + button after selecting the debug navigator. You will get the following window.
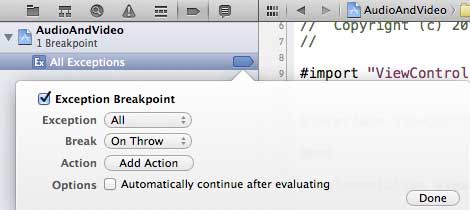
Then we need to select Add Exception Breakpoint, which will display the following window.
You can collect more information on debugging and other Xcode features from Xcode 4 user guide.
