 Data Structure
 Networking
 RDBMS
RDBMS Operating System
 Java
Java MS Excel
 iOS
iOS HTML
HTML CSS
CSS Android
 Python
 C Programming
 C++
C++ C#
C# MongoDB
 MySQL
MySQL Javascript
 PHP
PHP
- Selected Reading
- UPSC IAS Exams Notes
- Developer's Best Practices
- Questions and Answers
- Effective Resume Writing
- HR Interview Questions
- Computer Glossary
- Who is Who
Introduction-to-convolutions-using-python
In this article, we will learn about convolutions in Python 3.x. Or earlier. This articles come under neural networks and feature extraction.
Ide preferred − Jupyter notebook
Prerequisites − Numpy installed, Matplotlib installed
Installation
>>> pip install numpy
>>>pip install matplotlib
Convolution
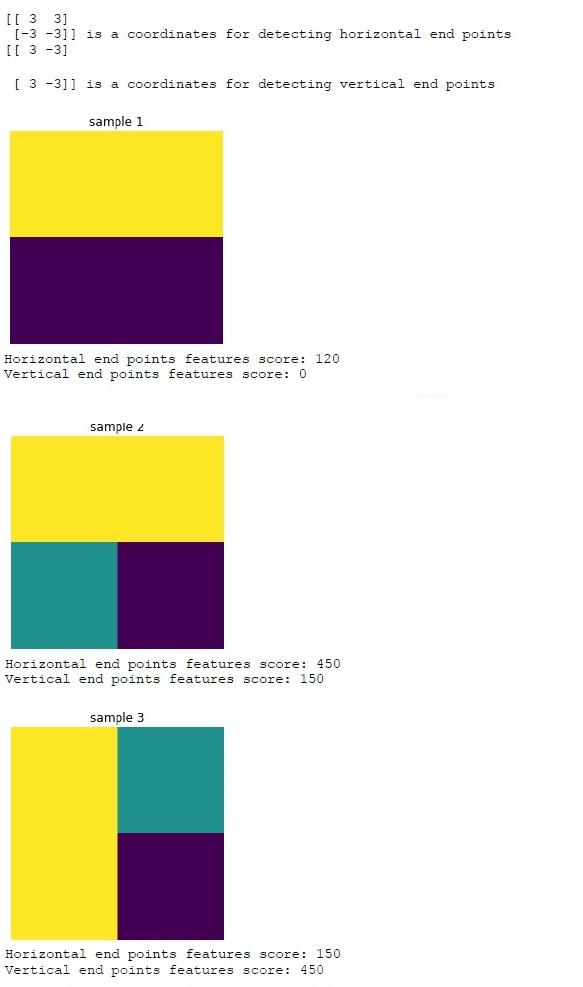
Convolution is a type of operation that can be performed on an image to extract the features from it by applying a smaller container called a kernel/coordinate container like a sliding window over the image. Depending on the values in the convolutional coordinate container, we can pick up specific patterns/features from the image.Here, we will learn about the detection of horizontal and vertical endpoints in an image using appropriate coordinate containers.
Now let’s see the practical implementation.
Example
import numpy as np
from matplotlib import pyplot
# initializing the images
img1 = np.array([np.array([100, 100]), np.array([80, 80])])
img2 = np.array([np.array([100, 100]), np.array([50, 0])])
img3 = np.array([np.array([100, 50]), np.array([100, 0])])
coordinates_horizontal = np.array([np.array([3, 3]), np.array([-3, -3])])
print(coordinates_horizontal, 'is a coordinates for detecting horizontal end points')
coordinates_vertical = np.array([np.array([3, -3]), np.array([3, - 3])])
print(coordinates_vertical, 'is a coordinates for detecting vertical end points')
#his will be an elemental multiplication followed by addition
def apply_coordinates(img, coordinates):
   return np.sum(np.multiply(img, coordinates))
# Visualizing img1
pyplot.imshow(img1)
pyplot.axis('off')
pyplot.title('sample 1')
pyplot.show()
# Checking for horizontal and vertical features in image1
print('Horizontal end points features score:',
apply_coordinates(img1, coordinates_horizontal))
print('Vertical end points features score:',
apply_coordinates(img1,coordinates_vertical))
# Visualizing img2
pyplot.imshow(img2)
pyplot.axis('off')
pyplot.title('sample 2')
pyplot.show()
# Checking for horizontal and vertical features in image2
print('Horizontal end points features score:',
apply_coordinates(img2, coordinates_horizontal))
print('Vertical end points features score:',
apply_coordinates(img2, coordinates_vertical))
# Visualizing img3
pyplot.imshow(img3)
pyplot.axis('off')
pyplot.title('sample 3')
pyplot.show()
# Checking for horizontal and vertical features in image1
print('Horizontal end points features score:',
apply_coordinates(img3,coordinates_horizontal))
print('Vertical end points features score:',
apply_coordinates(img3,coordinates_vertical))
Output

Conclusion
In this article, we learnt about introduction-to-convolutions-using-python 3.x. Or earlier & its implementation.
