 Data Structure
 Networking
 RDBMS
RDBMS Operating System
 Java
Java MS Excel
 iOS
iOS HTML
HTML CSS
CSS Android
 Python
 C Programming
 C++
C++ C#
C# MongoDB
 MySQL
MySQL Javascript
 PHP
PHP
- Selected Reading
- UPSC IAS Exams Notes
- Developer's Best Practices
- Questions and Answers
- Effective Resume Writing
- HR Interview Questions
- Computer Glossary
- Who is Who
Identifying handwritten digits using Logistic Regression in PyTorch?
In this we are going to use PyTorch to train a CNN to recognize handwritten digit classifier using the MNIST dataset.
MNIST is a widely used dataset for hand-written classification task covering more than 70k labeled 28*28 pixel grayscale images of handwritten digits. The dataset contains almost 60k training images and 10k test images. Our job is to train a model using 60k training images and subsequently test its classification accuracy on 10k test images.
Installation
First we need the MXNet latest version, for that just run the following on your terminal:
$pip install mxnet
And you will something like,
Collecting mxnet
Downloading https://files.pythonhosted.org/packages/60/6f/071f9ef51467f9f6cd35d1ad87156a29314033bbf78ad862a338b9eaf2e6/mxnet-1.2.0-py2.py3-none-win32.whl (12.8MB)
100% |????????????????????????????????| 12.8MB 131kB/s
Requirement already satisfied: numpy in c:\python\python361\lib\site-packages (from mxnet) (1.16.0)
Collecting graphviz (from mxnet)
Downloading https://files.pythonhosted.org/packages/1f/e2/ef2581b5b86625657afd32030f90cf2717456c1d2b711ba074bf007c0f1a/graphviz-0.10.1-py2.py3-none-any.whl
….
….
Installing collected packages: graphviz, mxnet
Successfully installed graphviz-0.10.1 mxnet-1.2.0
Second, we need the torch & torchvision library- if it’s not where you can install it using pip.
Import Library
import torch
import torchvision
Load the MNIST dataset
Before we start working on our program, we need the MNIST dataset. So lets loads the images and labels into memory and define the hyperparameters we’ll be using for this experiment.
#n_epochs are the number of times, we'll loop over the complete training dataset
n_epochs = 3
batch_size_train = 64
batch_size_test = 1000

#Learning_rate and momentum are for the opimizer
learning_rate = 0.01
momentum = 0.5
log_interval = 10

random_seed = 1
torch.backends.cudnn.enabled = False
torch.manual_seed(random_seed)
<torch._C.Generator at 0x2048010c690>
Now we are going to load the MNIST dataset using TorchVision. We are using the batch_size of 64 for training and size 1000 for testing on this dataset. For normalization, we’ll use the mean value of 0.1307 and standard deviation of 0.3081 of the MNIST dataset.
train_loader = torch.utils.data.DataLoader(
   torchvision.datasets.MNIST('/files/', train=True, download=True,
      transform=torchvision.transforms.Compose([
         torchvision.transforms.ToTensor(),
         torchvision.transforms.Normalize(
            (0.1307,), (0.3081,))
       ])
    ),
 batch_size=batch_size_train, shuffle=True)
test_loader = torch.utils.data.DataLoader(
   torchvision.datasets.MNIST('/files/', train=False, download=True,
      transform=torchvision.transforms.Compose([
         torchvision.transforms.ToTensor(),
         torchvision.transforms.Normalize(
            (0.1307,), (0.3081,))
      ])
   ),
batch_size=batch_size_test, shuffle=True)
Output
Downloading http://yann.lecun.com/exdb/mnist/train-images-idx3-ubyte.gz Downloading http://yann.lecun.com/exdb/mnist/train-labels-idx1-ubyte.gz
Downloading http://yann.lecun.com/exdb/mnist/t10k-images-idx3-ubyte.gz Downloading http://yann.lecun.com/exdb/mnist/t10k-labels-idx1-ubyte.gz
Processing...
Done!
Use test_loader to load test data
examples = enumerate(test_loader)
batch_idx, (example_data, example_targets) = next(examples)
example_data.shape
Output
torch.Size([1000, 1, 28, 28])
So from the output we can see we have one test data batch is a tensor of shape: [1000, 1, 28, 28] means- 1000 examples of 28*28 pixels in grayscale.
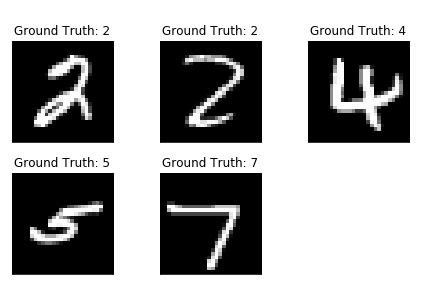
Lets plot some of the dataset using matplotlib.
import matplotlib.pyplot as plt
fig = plt.figure()
for i in range(5):
plt.subplot(2,3,i+1)
plt.tight_layout()
plt.imshow(example_data[i][0], cmap='gray', interpolation='none')
plt.title("Ground Truth: {}".format(example_targets[i]))
plt.xticks([])
plt.yticks([])
print(fig)
Output

Building the Network
Now we are going to build our network using 2-D convolutional layers followed by two fully-connected layers. We are going to create a new class for the network we wish to build but before that let’s import some modules.
import torch.nn as nn
import torch.nn.functional as F
import torch.optim as optim
class Net(nn.Module):
   def __init__(self):
      super(Net, self).__init__()
      self.conv1 = nn.Conv2d(1, 10, kernel_size=5)
      self.conv2 = nn.Conv2d(10, 20, kernel_size=5)
      self.conv2_drop = nn.Dropout2d()
      self.fc1 = nn.Linear(320, 50)
      self.fc2 = nn.Linear(50, 10)
   def forward(self, x):
      x = F.relu(F.max_pool2d(self.conv1(x), 2))
      x = F.relu(F.max_pool2d(self.conv2_drop(self.conv2(x)), 2))
      x = x.view(-1, 320)
      x = F.relu(self.fc1(x))
      x = F.dropout(x, training=self.training)
      x = self.fc2(x)
return F.log_softmax(x)
Initialize the network and the optimizer:
network = Net()
optimizer = optim.SGD(network.parameters(), lr = learning_rate,momentum = momentum)
Training the Model
Let's build our training model. So first check our network is in network mode and then interate overall training data once per epoch. Dataloader will load the individual batches. We set the gradients to zero using optimizer.zero_grad()
train_losses = []
train_counter = []
test_losses = []
test_counter = [i*len(train_loader.dataset) for i in range(n_epochs + 1)]
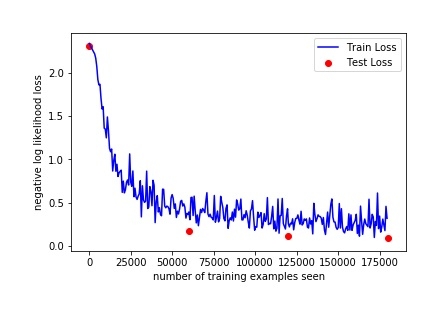
To create a nice training curve, we create two lists for saving training and testing losses. On the x-axis we want to display the number of training examples.
The backward() call we now collect a new set of gradients which we propagate back into each of the network’s parameters using optimizer.step().
def train(epoch):
   network.train()
   for batch_idx, (data, target) in enumerate(train_loader):
      optimizer.zero_grad()
      output = network(data)
      loss = F.nll_loss(output, target)
      loss.backward()
      optimizer.step()
   if batch_idx % log_interval == 0:
      print('Train Epoch: {} [{}/{} ({:.0f}%)]\tLoss: {:.6f}'.format(
         epoch, batch_idx * len(data), len(train_loader.dataset),
         100. * batch_idx / len(train_loader), loss.item()))
      train_losses.append(loss.item())
      train_counter.append(
         (batch_idx*64) + ((epoch-1)*len(train_loader.dataset)))
      torch.save(network.state_dict(), '/results/model.pth')
      torch.save(optimizer.state_dict(), '/results/optimizer.pth')
Neutral network modules, as well as optimizers, have the ability to save and load their internal state using .state_dict().
Now for our test loop, we sum up the test loss and keep track of correctly classified digits to compute the accuracy of the network.
def test():
   network.eval()
   test_loss = 0
   correct = 0
   with torch.no_grad():
   for data, target in test_loader:
      output = network(data)
      test_loss += F.nll_loss(output, target, size_average=False).item()
      pred = output.data.max(1, keepdim=True)[1]
      correct += pred.eq(target.data.view_as(pred)).sum()
   test_loss /= len(test_loader.dataset)
   test_losses.append(test_loss)
   print('\nTest set: Avg. loss: {:.4f}, Accuracy: {}/{} ({:.0f}%)\n'.format(
      test_loss, correct, len(test_loader.dataset),
      100. * correct / len(test_loader.dataset)))
To run the training, we add a test() call before we loop over n_epochs to evaluate our model with randomly initialized parameters.
test()
for epoch in range(1, n_epochs + 1):
   train(epoch)
   test()
Output
Test set: Avg. loss: 2.3048, Accuracy: 1063/10000 (10%)

Train Epoch: 1 [0/60000 (0%)]Loss: 2.294911
Train Epoch: 1 [640/60000 (1%)]Loss: 2.314225
Train Epoch: 1 [1280/60000 (2%)]Loss: 2.290719
Train Epoch: 1 [1920/60000 (3%)]Loss: 2.294191
Train Epoch: 1 [2560/60000 (4%)]Loss: 2.246799
Train Epoch: 1 [3200/60000 (5%)]Loss: 2.292224
Train Epoch: 1 [3840/60000 (6%)]Loss: 2.216632
Train Epoch: 1 [4480/60000 (7%)]Loss: 2.259646
Train Epoch: 1 [5120/60000 (9%)]Loss: 2.244781
Train Epoch: 1 [5760/60000 (10%)]Loss: 2.245569
Train Epoch: 1 [6400/60000 (11%)]Loss: 2.203358
Train Epoch: 1 [7040/60000 (12%)]Loss: 2.192290
Train Epoch: 1 [7680/60000 (13%)]Loss: 2.040502
Train Epoch: 1 [8320/60000 (14%)]Loss: 2.102528
Train Epoch: 1 [8960/60000 (15%)]Loss: 1.944297
Train Epoch: 1 [9600/60000 (16%)]Loss: 1.886444
Train Epoch: 1 [10240/60000 (17%)]Loss: 1.801920
Train Epoch: 1 [10880/60000 (18%)]Loss: 1.421267
Train Epoch: 1 [11520/60000 (19%)]Loss: 1.491448
Train Epoch: 1 [12160/60000 (20%)]Loss: 1.600088
Train Epoch: 1 [12800/60000 (21%)]Loss: 1.218677
Train Epoch: 1 [13440/60000 (22%)]Loss: 1.060651
Train Epoch: 1 [14080/60000 (23%)]Loss: 1.161512
Train Epoch: 1 [14720/60000 (25%)]Loss: 1.351181
Train Epoch: 1 [15360/60000 (26%)]Loss: 1.012257
Train Epoch: 1 [16000/60000 (27%)]Loss: 1.018847
Train Epoch: 1 [16640/60000 (28%)]Loss: 0.944324
Train Epoch: 1 [17280/60000 (29%)]Loss: 0.929246
Train Epoch: 1 [17920/60000 (30%)]Loss: 0.903336
Train Epoch: 1 [18560/60000 (31%)]Loss: 1.243159
Train Epoch: 1 [19200/60000 (32%)]Loss: 0.696106
Train Epoch: 1 [19840/60000 (33%)]Loss: 0.902251
Train Epoch: 1 [20480/60000 (34%)]Loss: 0.986816
Train Epoch: 1 [21120/60000 (35%)]Loss: 1.203934
Train Epoch: 1 [21760/60000 (36%)]Loss: 0.682855
Train Epoch: 1 [22400/60000 (37%)]Loss: 0.653592
Train Epoch: 1 [23040/60000 (38%)]Loss: 0.932158
Train Epoch: 1 [23680/60000 (39%)]Loss: 1.110188
Train Epoch: 1 [24320/60000 (41%)]Loss: 0.817414
Train Epoch: 1 [24960/60000 (42%)]Loss: 0.584215
Train Epoch: 1 [25600/60000 (43%)]Loss: 0.724121
Train Epoch: 1 [26240/60000 (44%)]Loss: 0.707071
Train Epoch: 1 [26880/60000 (45%)]Loss: 0.574117
Train Epoch: 1 [27520/60000 (46%)]Loss: 0.652862
Train Epoch: 1 [28160/60000 (47%)]Loss: 0.654354
Train Epoch: 1 [28800/60000 (48%)]Loss: 0.811647
Train Epoch: 1 [29440/60000 (49%)]Loss: 0.536885
Train Epoch: 1 [30080/60000 (50%)]Loss: 0.849961
Train Epoch: 1 [30720/60000 (51%)]Loss: 0.844555
Train Epoch: 1 [31360/60000 (52%)]Loss: 0.687859
Train Epoch: 1 [32000/60000 (53%)]Loss: 0.766818
Train Epoch: 1 [32640/60000 (54%)]Loss: 0.597061
Train Epoch: 1 [33280/60000 (55%)]Loss: 0.691049
Train Epoch: 1 [33920/60000 (57%)]Loss: 0.573049
Train Epoch: 1 [34560/60000 (58%)]Loss: 0.405698
Train Epoch: 1 [35200/60000 (59%)]Loss: 0.480660
Train Epoch: 1 [35840/60000 (60%)]Loss: 0.582871
Train Epoch: 1 [36480/60000 (61%)]Loss: 0.496494
……
……
…….
Train Epoch: 3 [49920/60000 (83%)]Loss: 0.253500
Train Epoch: 3 [50560/60000 (84%)]Loss: 0.364354
Train Epoch: 3 [51200/60000 (85%)]Loss: 0.333843
Train Epoch: 3 [51840/60000 (86%)]Loss: 0.096922
Train Epoch: 3 [52480/60000 (87%)]Loss: 0.282102
Train Epoch: 3 [53120/60000 (88%)]Loss: 0.236428
Train Epoch: 3 [53760/60000 (90%)]Loss: 0.610584
Train Epoch: 3 [54400/60000 (91%)]Loss: 0.198840
Train Epoch: 3 [55040/60000 (92%)]Loss: 0.344225
Train Epoch: 3 [55680/60000 (93%)]Loss: 0.158644
Train Epoch: 3 [56320/60000 (94%)]Loss: 0.216912
Train Epoch: 3 [56960/60000 (95%)]Loss: 0.309554
Train Epoch: 3 [57600/60000 (96%)]Loss: 0.243239
Train Epoch: 3 [58240/60000 (97%)]Loss: 0.176541
Train Epoch: 3 [58880/60000 (98%)]Loss: 0.456749
Train Epoch: 3 [59520/60000 (99%)]Loss: 0.318569

Test set: Avg. loss: 0.0912, Accuracy: 9716/10000 (97%)
Evaluating the Model’s Performance
So with only 3 epochs of training we managed to achieve 97% accuracy on the test set. With randomly initialized parameters, we started with 10% accuracy on the test set initially, before starting the training.
Lets plot our training curve:
fig = plt.figure()
plt.plot(train_counter, train_losses, color='blue')
plt.scatter(test_counter, test_losses, color='red')
plt.legend(['Train Loss', 'Test Loss'], loc='upper right')
plt.xlabel('number of training examples seen')
plt.ylabel('negative log likelihood loss')
fig
Output

By checking above output, we can increase the number of epochs to see some more results,As the accuracy is increased by checking the 3 epoches.
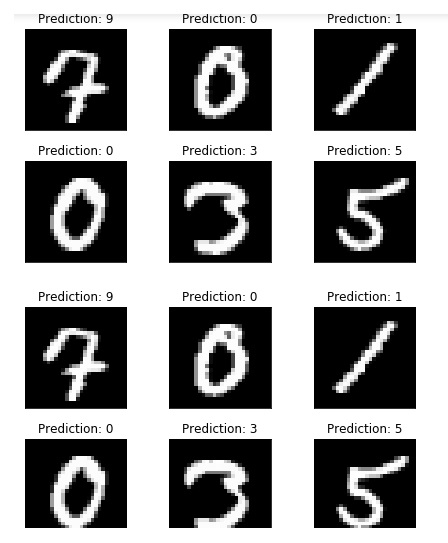
But before that, run some few more examples and compare the model’s output:
with torch.no_grad():
   output = network(example_data)
fig = plt.figure()
for i in range(6):
   plt.subplot(2,3,i+1)
   plt.tight_layout()
   plt.imshow(example_data[i][0], cmap='gray', interpolation='none')
   plt.title("Prediction: {}".format(
      output.data.max(1, keepdim=True)[1][i].item()))
   plt.xticks([])
   plt.yticks([])
fig

As we can see our models predictions, it looks similar to be on point for those examples.

