
Article Categories
- All Categories
-
 Data Structure
-
 Networking
-
 RDBMS
RDBMS
-
 Operating System
-
 Java
Java
-
 MS Excel
-
 iOS
iOS
-
 HTML
HTML
-
 CSS
CSS
-
 Android
-
 Python
-
 C Programming
-
 C++
C++
-
 C#
C#
-
 MongoDB
-
 MySQL
MySQL
-
 Javascript
-
 PHP
PHP
-
 Economics & Finance
Selected Reading
How to write partial title of X-axis in italics using ggplot2 of R?
Of course, writing axes titles help viewers to understand the plot in a better way because they add more information to the plot. In general, the axes titles have simple font but we can change partial or complete title to italics to get the viewers attraction. This is needed when we want to highlight the title by making it different. In ggplot2, we can do this by using expression.
Example
Consider the below data frame −
set.seed(1)
x<-rnorm(10)
y<-rnorm(10,1)
df<-data.frame(x,y)
df
Output
      x       y
1 -0.6264538  2.5117812
2  0.1836433  1.3898432
3 -0.8356286  0.3787594
4  1.5952808 -1.2146999
5  0.3295078  2.1249309
6 -0.8204684  0.9550664
7  0.4874291  0.9838097
8  0.7383247  1.9438362
9  0.5757814  1.8212212
10 -0.3053884 1.5939013
> library(ggplot2)
Creating the scatterplot between x and y −
ggplot(df,aes(x,y))+geom_point()+
+ labs(x=expression(paste("X comes from normal distribution")))
Output

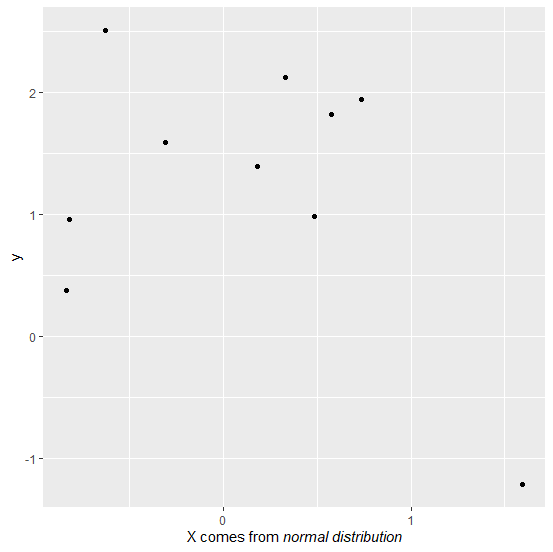
Now suppose we want to write normal distribution in italics then it can be done as shown below −
ggplot(df,aes(x,y))+geom_point()+labs(x=expression(paste("X comes from ",italic("normal distribution"))))
Output

Updated on: 2020-08-21T12:37:06+05:30
7K+ Views

Advertisements