
Article Categories
- All Categories
-
 Data Structure
-
 Networking
-
 RDBMS
RDBMS
-
 Operating System
-
 Java
Java
-
 MS Excel
-
 iOS
iOS
-
 HTML
HTML
-
 CSS
CSS
-
 Android
-
 Python
-
 C Programming
-
 C++
C++
-
 C#
C#
-
 MongoDB
-
 MySQL
MySQL
-
 Javascript
-
 PHP
PHP
-
 Economics & Finance
Selected Reading
How to visualize a data frame that contains missing values in R?
If a data frame contains missing value then visualising it in base R is not easily possible but we can make use of visdat package for this purpose. The vis_dat function of visdat package helps to visualize any data frame even if it contains missing values. For example, if a data frame df contains missing value then it can be visualized as vis_dat(df).
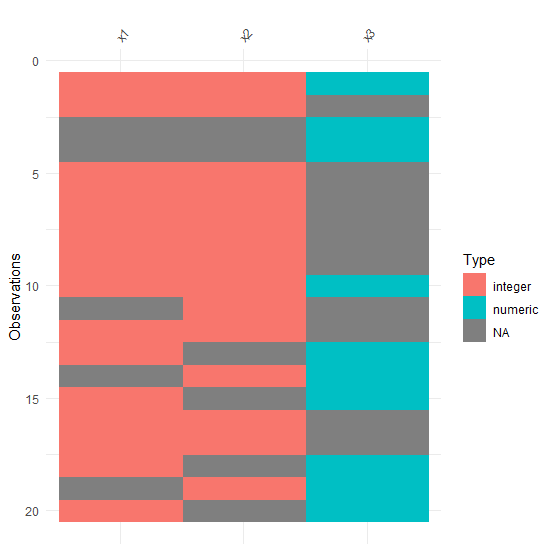
Example1
Consider the below data frame −
> x1<-sample(c(NA,1:2),20,replace=TRUE)
> x2<-sample(c(NA,21:24),20,replace=TRUE)
> x3<-sample(c(NA,5,10),20,replace=TRUE)
> df1<-data.frame(x1,x2,x3)
> df1
Output
 x1 x2 x3
1 1 23 10
2 1 23 NA
3 NA NA 10
4 NA NA 10
5 1 24 NA
6 2 22 NA
7 2 24 NA
8 2 24 NA
9 2 21 NA
10 1 23 10
11 NA 24 NA
12 2 22 NA
13 2 NA 10
14 NA 24 10
15 2 NA 5
16 2 21 NA
17 2 23 NA
18 2 NA 5
19 NA 21 10
20 2 NA 5
Loading visdat package and creating the plot of the data frame −
Example
> library(visdat)
> vis_dat(df1)
Output
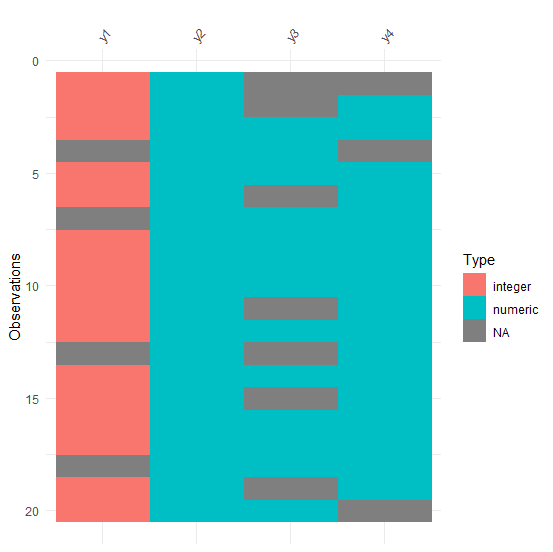
Example2
> y1<-sample(c(NA,rpois(5,2)),20,replace=TRUE)
> y2<-rnorm(20)
> y3<-sample(c(NA,rnorm(5,2,2.1)),20,replace=TRUE)
> y4<-sample(c(NA,runif(5,2,3)),20,replace=TRUE)
> df2<-data.frame(y1,y2,y3,y4)
> df2
Output
  y1 y2 y3 y4
1 4 0.61081616 NA NA
2 3 0.97203884 NA 2.039603
3 1 -0.19848158 2.798295 2.996374
4 NA -0.06643532 1.327976 NA
5 1 -0.08782965 1.327976 2.996374
6 1 -1.74682203 NA 2.996374
7 NA -1.07706177 3.255620 2.039603
8 1 -0.47827253 1.327976 2.670070
9 1 -1.52099043 1.524140 2.773155
10 3 0.80431131 2.798295 2.773155
11 4 -0.92503650 NA 2.996374
12 1 0.09717851 1.524140 2.429227
13 NA 0.59296946 NA 2.039603
14 4 0.40156867 1.524140 2.996374
15 1 -0.25442642 NA 2.773155
16 1 -1.65687286 2.798295 2.996374
17 1 0.35774521 1.524140 2.773155
18 NA 0.09490436 1.524140 2.773155
19 4 -0.63289635 NA 2.773155
20 1 -0.48500639 1.524140 NA
Example
> vis_dat(df2)
Output

Updated on: 2026-03-11T22:50:54+05:30
448 Views

Advertisements