
Article Categories
- All Categories
-
 Data Structure
-
 Networking
-
 RDBMS
RDBMS
-
 Operating System
-
 Java
Java
-
 MS Excel
-
 iOS
iOS
-
 HTML
HTML
-
 CSS
CSS
-
 Android
-
 Python
-
 C Programming
-
 C++
C++
-
 C#
C#
-
 MongoDB
-
 MySQL
MySQL
-
 Javascript
-
 PHP
PHP
-
 Economics & Finance
Selected Reading
How to view the complete output of tibble in R?
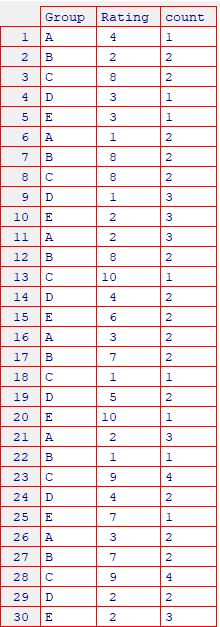
Tibbles are created when we analyze data using dplyr package and if the data size is large then only 10 values are printed in R. If we want to display the complete output of tibble then View function needs to be used. For example, if we want to perform calculation of counts then we should add View() at the end of the code with pipe operator.
Example
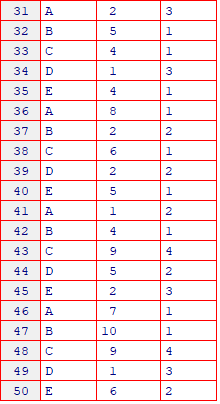
df%>%group_by(Group,Rating)%>%mutate(count=n())%>%View()
Output

Updated on: 2026-03-11T23:22:53+05:30
1K+ Views

Advertisements