 Data Structure
 Networking
 RDBMS
RDBMS Operating System
 Java
Java MS Excel
 iOS
iOS HTML
HTML CSS
CSS Android
 Python
 C Programming
 C++
C++ C#
C# MongoDB
 MySQL
MySQL Javascript
 PHP
PHP
- Selected Reading
- UPSC IAS Exams Notes
- Developer's Best Practices
- Questions and Answers
- Effective Resume Writing
- HR Interview Questions
- Computer Glossary
- Who is Who
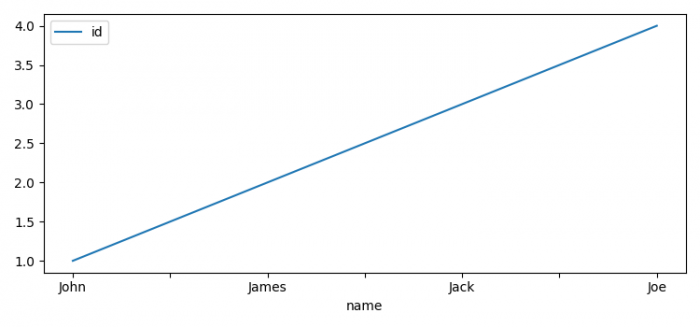
How to use Matplotlib to plot PySpark SQL results?
To use Matplotlib to plot PySpark SQL results, we can take the following steps−
- Set the figure size and adjust the padding between and around the subplots.
- Get the instance that is the main Entry Point for Spark functionality.
- Get the instance of a variant of Spark SQL that integrates with the data stored in Hive.
- Make a list of records as a tuple.
- Distribute a local Python collection to form an RDD.
- Map the list record as a DB schema.
- Get the schema instance to make an entry into "my_table".
- Insert a record into a table.
- Read the SQL query, retrieve the record.
- Convert the fetched record into a data frame.
- Set the index with name attribute and plot them.
- To display the figure, use show() method.
Example
from pyspark.sql import Row
from pyspark.sql import HiveContext
import pyspark
import matplotlib.pyplot as plt

plt.rcParams["figure.figsize"] = [7.50, 3.50]
plt.rcParams["figure.autolayout"] = True

sc = pyspark.SparkContext()
sqlContext = HiveContext(sc)

test_list = [(1, 'John'), (2, 'James'), (3, 'Jack'), (4, 'Joe')]
rdd = sc.parallelize(test_list)
people = rdd.map(lambda x: Row(id=int(x[0]), name=x[1]))
schemaPeople = sqlContext.createDataFrame(people)
sqlContext.registerDataFrameAsTable(schemaPeople, "my_table")

df = sqlContext.sql("Select * from my_table")
df = df.toPandas()
df.set_index('name').plot()

plt.show()
Output


Advertisements
