
Article Categories
- All Categories
-
 Data Structure
-
 Networking
-
 RDBMS
RDBMS
-
 Operating System
-
 Java
Java
-
 MS Excel
-
 iOS
iOS
-
 HTML
HTML
-
 CSS
CSS
-
 Android
-
 Python
-
 C Programming
-
 C++
C++
-
 C#
C#
-
 MongoDB
-
 MySQL
MySQL
-
 Javascript
-
 PHP
PHP
-
 Economics & Finance
Selected Reading
How to set the text position using geom_text in R?
To set the text position using geom_text, we can use the value for the X-axis and Y-axis with appropriate positions. We need to make sure that the values we set for both the axes do not lie within the data otherwise the text will be printed on the plot we want to draw and it will become less attractive
Example
Consider the below data frame −
x<-rnorm(2000,35,4)
df<-data.frame(x)
head(df,20)
Output
    x
1  37.87815
2  39.43620
3  33.10465
4  38.23600
5  28.02520
6  38.18482
7  40.03815
8  35.97931
9  36.22602
10 38.82414
11 38.42714
12 37.73128
13 37.60845
14 36.77148
15 32.32440
16 34.78278
17 36.14291
18 36.37788
19 29.43467
20 32.47102
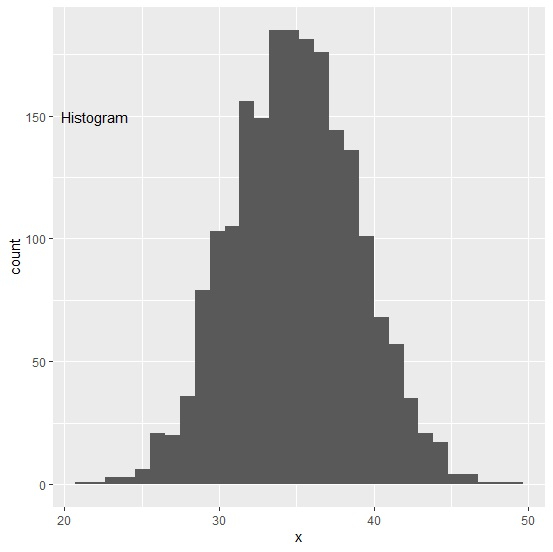
Loading ggplot2 package and creating histogram of x with a text label “Histogram” −
Example
library(ggplot2)
ggplot(df,aes(x))+geom_histogram(bins=30)+geom_text(data=data.frame(),aes(label="Histogram",x=22,y=150))
Output

Updated on: 2026-03-11T22:50:56+05:30
607 Views

Advertisements